ManageEngine recognized in the 2023 Gartner® Magic Quadrant™ for Application Performance Monitoring and Observability. Read the report
✕Applications Manager's WebSphere monitoring provides in-depth visibility into the performance of IBM WebSphere Application Server (WAS) as well as the applications deployed on it. Monitor WebSphere to detect performance issues quickly and reduce the time taken to troubleshoot problems.
Use Applications Manager's WebSphere performance monitor to track overall availability, health and performance of the WebSphere application server (WAS). Ensure optimal resource allocation by measuring CPU/memory usage, JVM usage and response time. Track performance of applications using critical metrics such as Live Sessions, Enterprise Java Beans (EJBs), JDBC connection pools, and JMS queues with our WebSphere monitor.
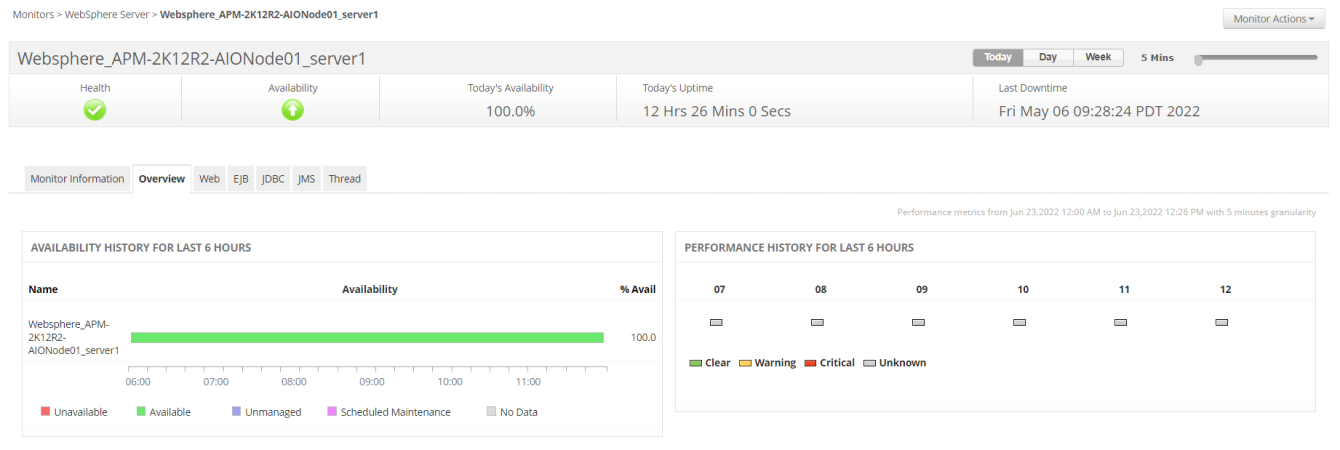
Applications Manager's WebSphere connection pool monitoring feature proactively tracks connection pool usage and prevents performance deterioration of Java applications. Effectively track thread pool utilization to prevent deadlocks and detect thread pool exhaustion. Automate taking thread dumps within intervals to identify problematic code.
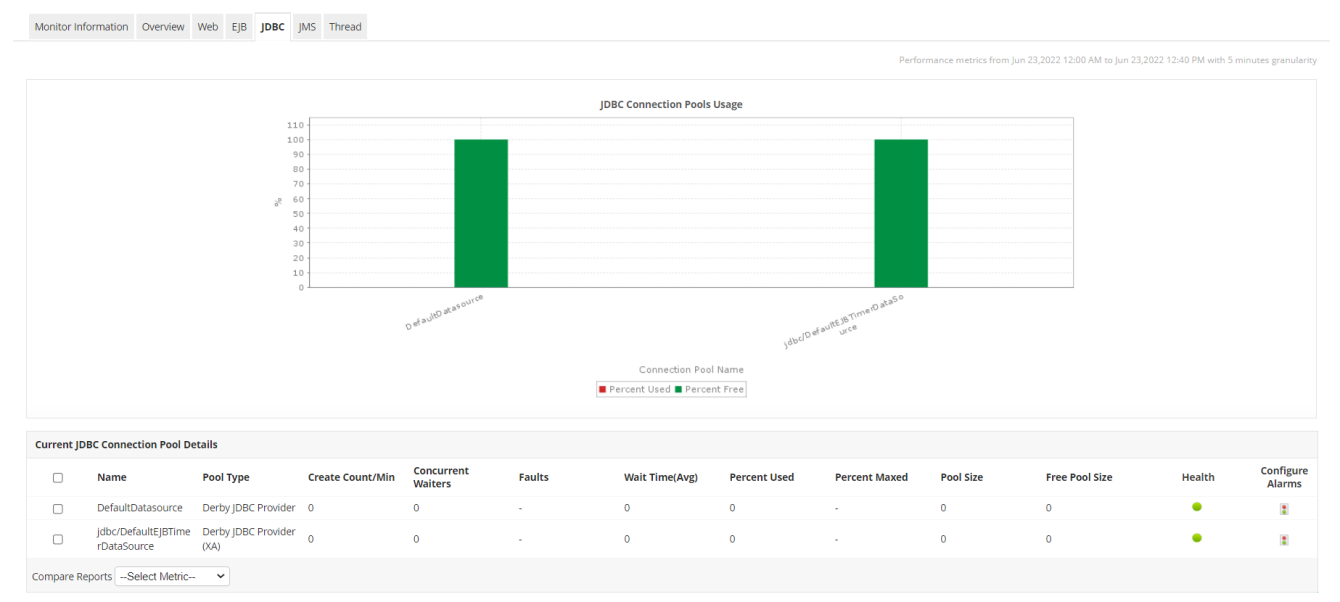
Fine tune your application's efficiency by leveraging Applications Manager's WebSphere application server monitoring capability to gain insight on the number of active sessions, EJB throughput, JMS queue depth of web applications so that you can plan your capacity accurately.
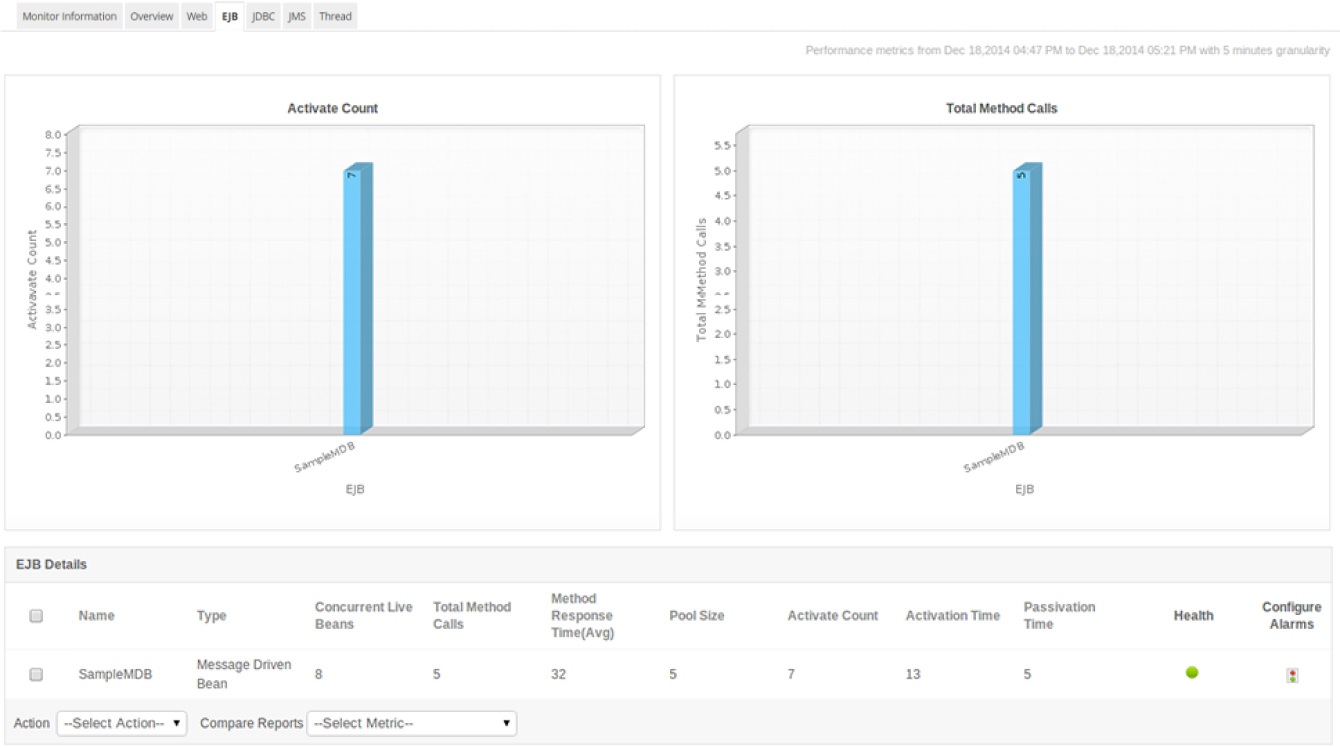
WebSphere Network deployment environment can have more number of nodes and more servers per node, making it highly useful in huge network environments. With automated discovery capability of Applications Manager's WebSphere monitoring, you can save time in manually configuring the nodes. You can also selectively monitor the nodes and servers per node.
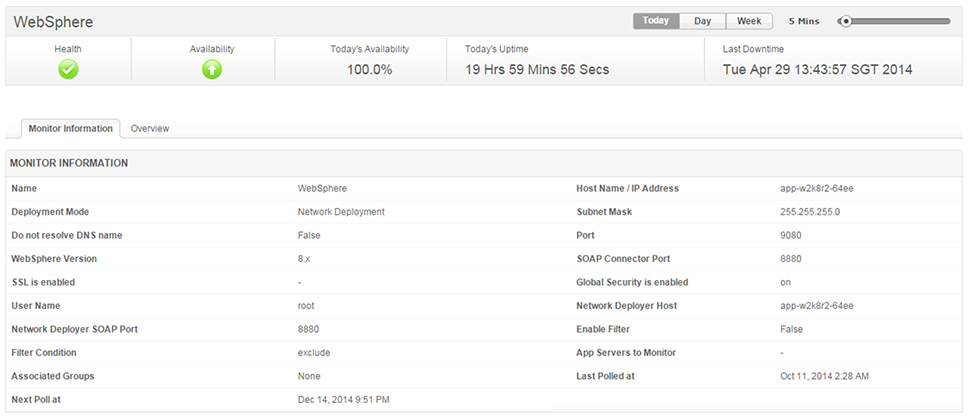
With our WebSphere monitoring tool, proactively detect WebSphere issues as and when they arise and take action before the end users are affected. Automate corrective actions - such as increasing database connection pool size or restarting the WebSphere server when the memory usage increases - with the help of custom scripts.
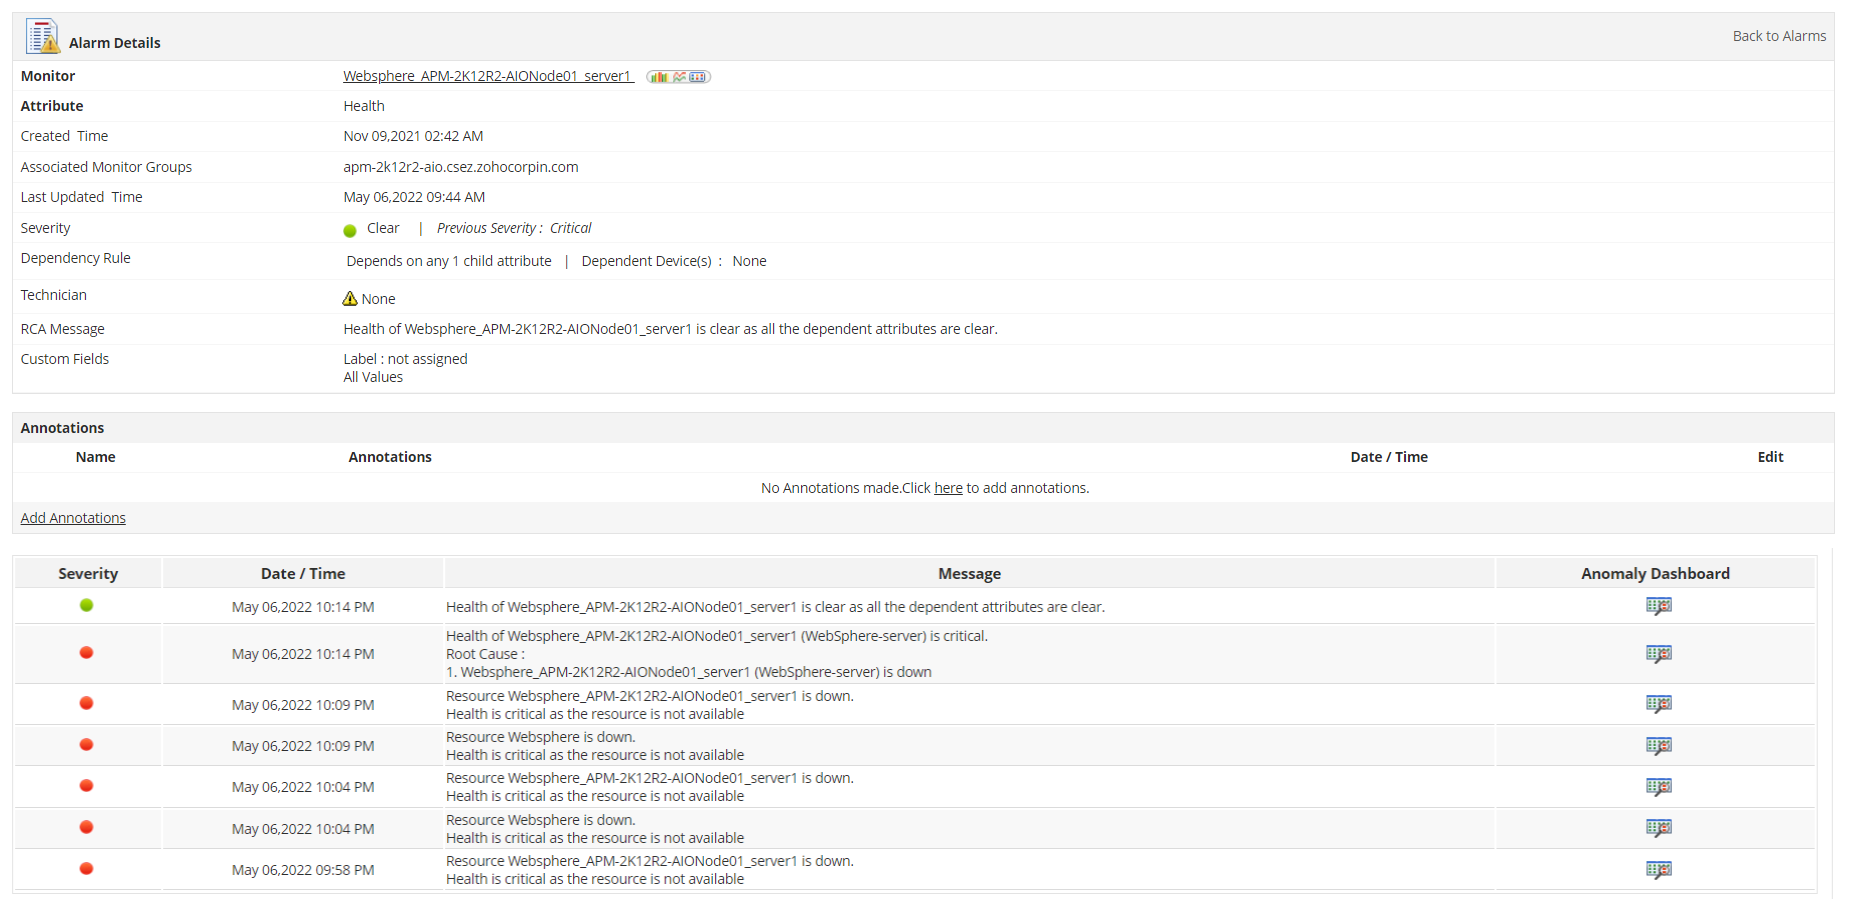
One of the major benefits of having a dedicated WebSphere Performance Monitoring tool is its ability to gain an accurate overview about the health and performance of your WAS environment with the help of out-of-the-box reports and dashboards. Our IBM WebSphere performance monitoring platform has a comprehensive dashboard that provides graphical representation of core metrics such as system load, server response rate, and transaction rate.
Experience WebSphere monitoring on your own by downloading Applications Manager's full-fledged, 30-day free trial!

It allows us to track crucial metrics such as response times, resource utilization, error rates, and transaction performance. The real-time monitoring alerts promptly notify us of any issues or anomalies, enabling us to take immediate action.
Reviewer Role: Research and Development


