Computer networks form the basis of digital businesses. To ensure business continuity, the IT infrastructures behind these networks need to be monitored and managed night and day. IT admins often run into problems while managing IT infrastructure, a key part of their work. An even more important part is troubleshooting network issues. While reading further, we will discuss:
Network troubleshooting is the systematic process of identifying, analyzing and resolving network issues. In other words, troubleshooting network issues refers to rectifying problems related to connectivity, security, performance and other aspects of networks. Network troubleshooting is essential to reduce MTTR, restore network uptime and regularize network operations.
Network issues range from device or service unavailability to slow response time, poor server health, and subpar network performance. The issues arising in a network can be extensive, so we’ve grouped network issues into five categories based on their origin. Based on the category, suitable network troubleshooting techniques can be employed.
If a systematic process isn't followed during troubleshooting, it can often do more harm than good. Network troubleshooting problems can then overwhelm you on top of the existing issues. Troubleshooting network issues is much easier when you can identify the source of the issue and follow up based on some set guidelines.
Hardware unavailability and performance issues are the major network problem that is often due to device misconfigurations and hardware load. Common hardware issues include sudden spike in temperature, improper ventilation, fluctuations in voltage/ power supply, abnormal processor speed, poor battery etc., These hardware problems can adversely affect network health, leading to unforeseen downtime or network outages, for which hardware monitoring is essential.
One of the major network issues could be poor physical connectivity due to defective cables or connectors. This happens when a network cable is broken, cabled loose, or accidentally gets disconnected and creates network issues on the devices to which they are connected.
Finding the root cause of the issue, in this case, includes checking each and every cable one by one, which is a real task. The easy and recommended way would be monitoring all network interfaces with a network performance monitor like OpManager.
Software issues such as service unavailability, process unavailability, OS issues, and slow service response time could harm server availability and health and in turn, the uptime and performance of business critical applications. This affects end user experience which costs the business its reputation. This creates the need to monitor applications and services from time to time and prevent software issues.
Bandwidth is an important metric that defines the network's ability to transfer data between devices or the internet in a given span of time. Higher bandwidth means faster data transmission across a network that keeps many devices connected all at once. When large application runs, it causes network congestion, which creates the risk of insufficient bandwidth for other network devices. This in turn results in slow download speed over the internet.
Causes of high bandwidth include unstable WAN links, poor VoIP calls due to jitter, latency and packet loss, larger downloads, file sharing, etc.,
DNS issues are the network problems that network admins tend to overlook sometimes, but are very common too. DNS issues occur when you're unable to access internet or connect to an IP address. Few hours offline can create negative impact on end users and the businesses that depend on you. This is why it's important to identify and fix DNS problems at the earliest with a network management software . DNS issues could also be due to poor DNS configurations, high DNS latency, high TTL values, hardware or network failures etc.,
Whenever you configure or re-configure a device, connect to VLAN or VPN networks, or upgrade hardware on your network, you need to make sure that the devices are configured correctly in order to ensure smooth functioning of your network. Many network problems are due to device misconfigurations that can have an effect on different parts of the network and create major problems. To prevent such issues, you can rely on network monitoring application that helps monitor and manage device configurations.
Enterprises have multiple firewalls in their network wherein each firewall will have unique configurations and rules. Managing and organizing these rules without being overlapped and ensuring the rules are up-to-date is a real task. Failing to do so, will make the network vulnerable to threats for which firewall monitoring is pivotal.
In a network, no two devices can share the same IP address and when it happens, neither systems can connect to the network. Detecting and managing such rogue IPs is important for the network to function optimally.
IT admins need to be prepared to handle network issues and reduce their mean time to repair (MTTR). To achieve a lower MTTR, you should have a clear understanding of network issues. The four-step method discussed below can help you better understand underlying network problems and solutions, prevent network troubleshooting issues and maintain a five-nines network.
Step 1: Identify the network issue.
Step 2: Gather information and track the root cause.
Step 3: Troubleshoot the issue.
Step 4: Document the issue, the process and the network troubleshooting solutions.
By following the routine above, you can clearly understand network issues and teach other network technicians about possible network pitfalls and the necessary troubleshooting steps. However, the real challenge is identifying and troubleshooting network problems before end users are affected.
ManageEngine OpManager is comprehensive network monitoring and network troubleshooting software. It helps you diagnose network issues in switches, routers, servers, and storage devices for availability, health, and performance. OpManager also monitors response time, services, processes, and other hardware metrics, along with packet loss monitoring. By providing real-time insights into your network, OpManager helps you identify and troubleshoot network issues before end users are impacted.
Network admins commonly have to troubleshoot network problems involving:
The underlying causes of these network issues, as well as their solutions, are discussed below.
Slow network speeds and poor WAN performance mostly affect the internal team, but the repercussions of slow response time for an application or application server can be disastrous. Slow response time not only impacts your revenue and reputation but also ends in legal disputes, as you might have a QoS agreement with your clients.
The common causes of slow response time are:
High CPU utilization is a crucial factor for network availability. When a device runs high-end applications and require more resources for execution, there is a chance for CPU utilization to spike to support execution. In this instance, such a high CPU utilization will increase network traffic, overload server, and eventually halt the user interface.
When this happens too often, CPU performance will be impacted as the processing speed of CPU tends to deplete, and few incoming requests tend to get dropped. In other words, the common cause of high CPU utilization is increased network traffic that overloads CPU and server.

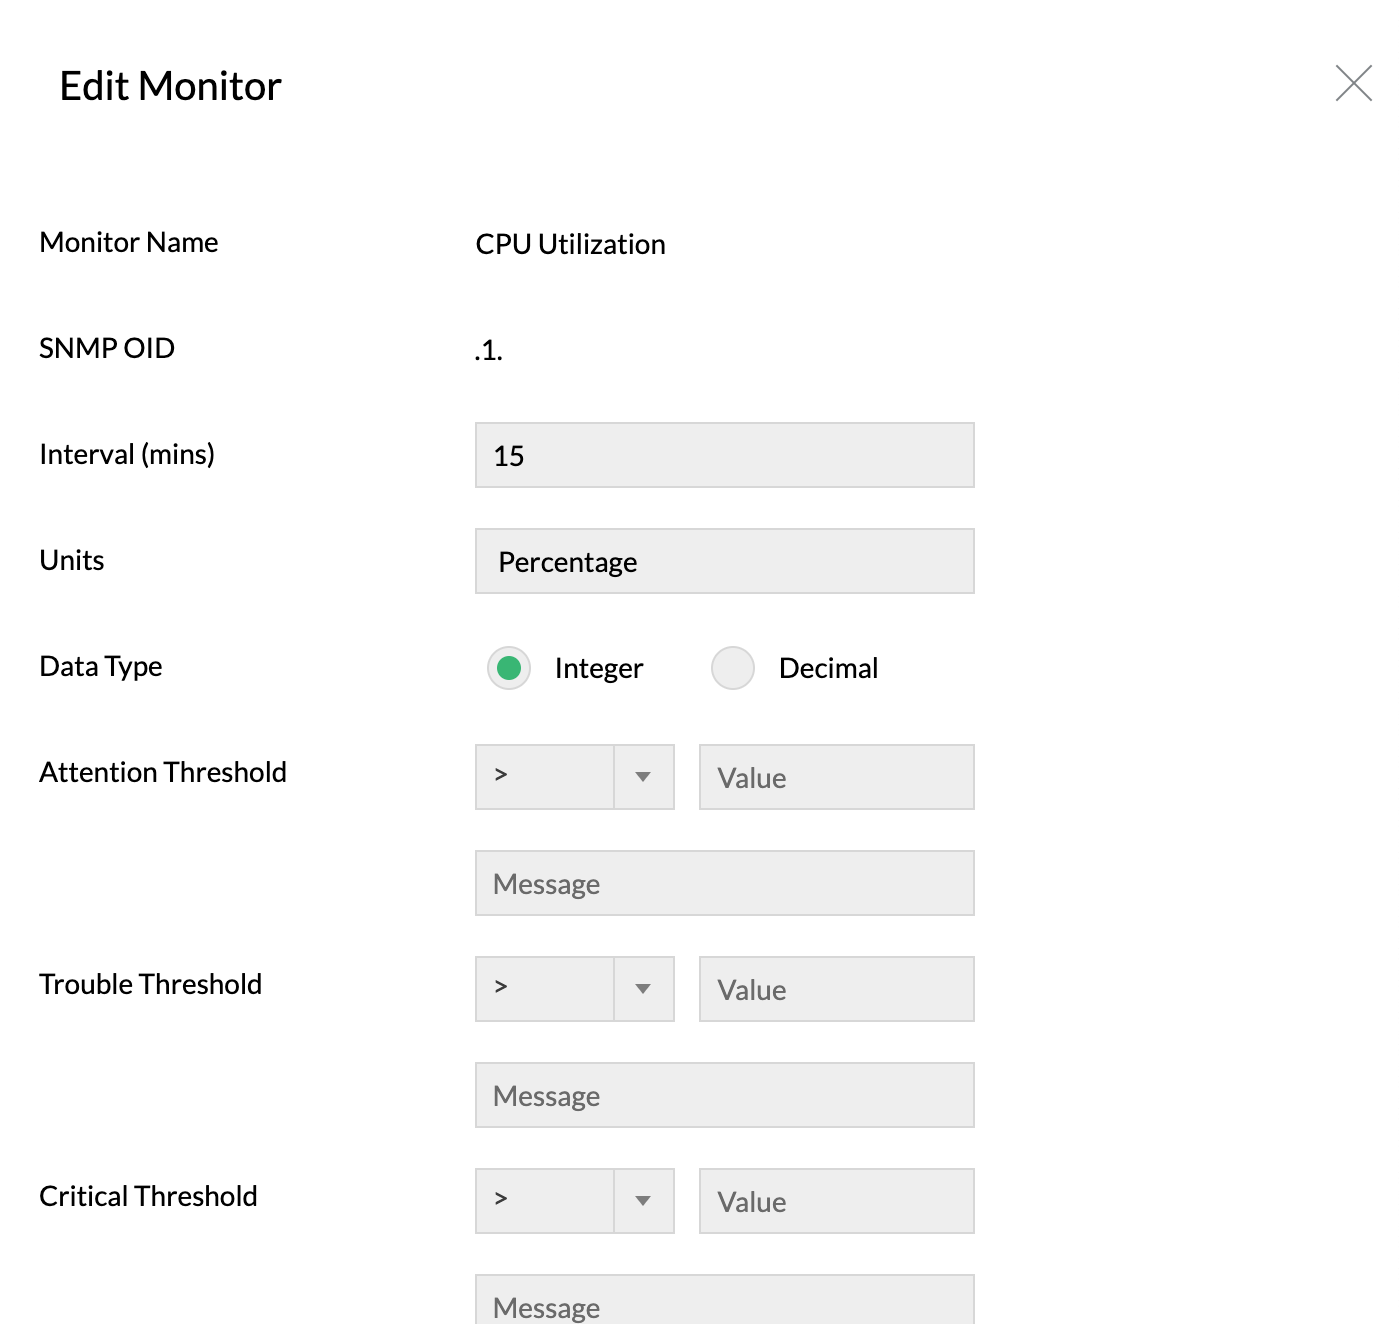
Using OpManager's CPU usage monitor, you can monitor CPU utilization and set thresholds to alert you on abnormal CPU usage limit or when the processor time reaches its level. These alerts can be sent via multiple notification channels such as SMS, email, slack, and web alarms with which you can troubleshoot CPU utilization issues at the earliest.
Wireless networks are the core part of a network that could disrupt network operations with interferences. In a network, signals from other wireless devices such as bluetooth devices, cordless phones, etc., can also interfere with WiFi signals and create poor Wi-Fi experience for the users. Few Wi-Fi issues include low signal strength, slow internet connection, slow file transfers, intermittent Wi-Fi disconnection etc., When such incidents happen, network admins need to identify the reason for the issue and fix it quickly. A Wi-Fi network test tool can help identify the root cause of the interference.

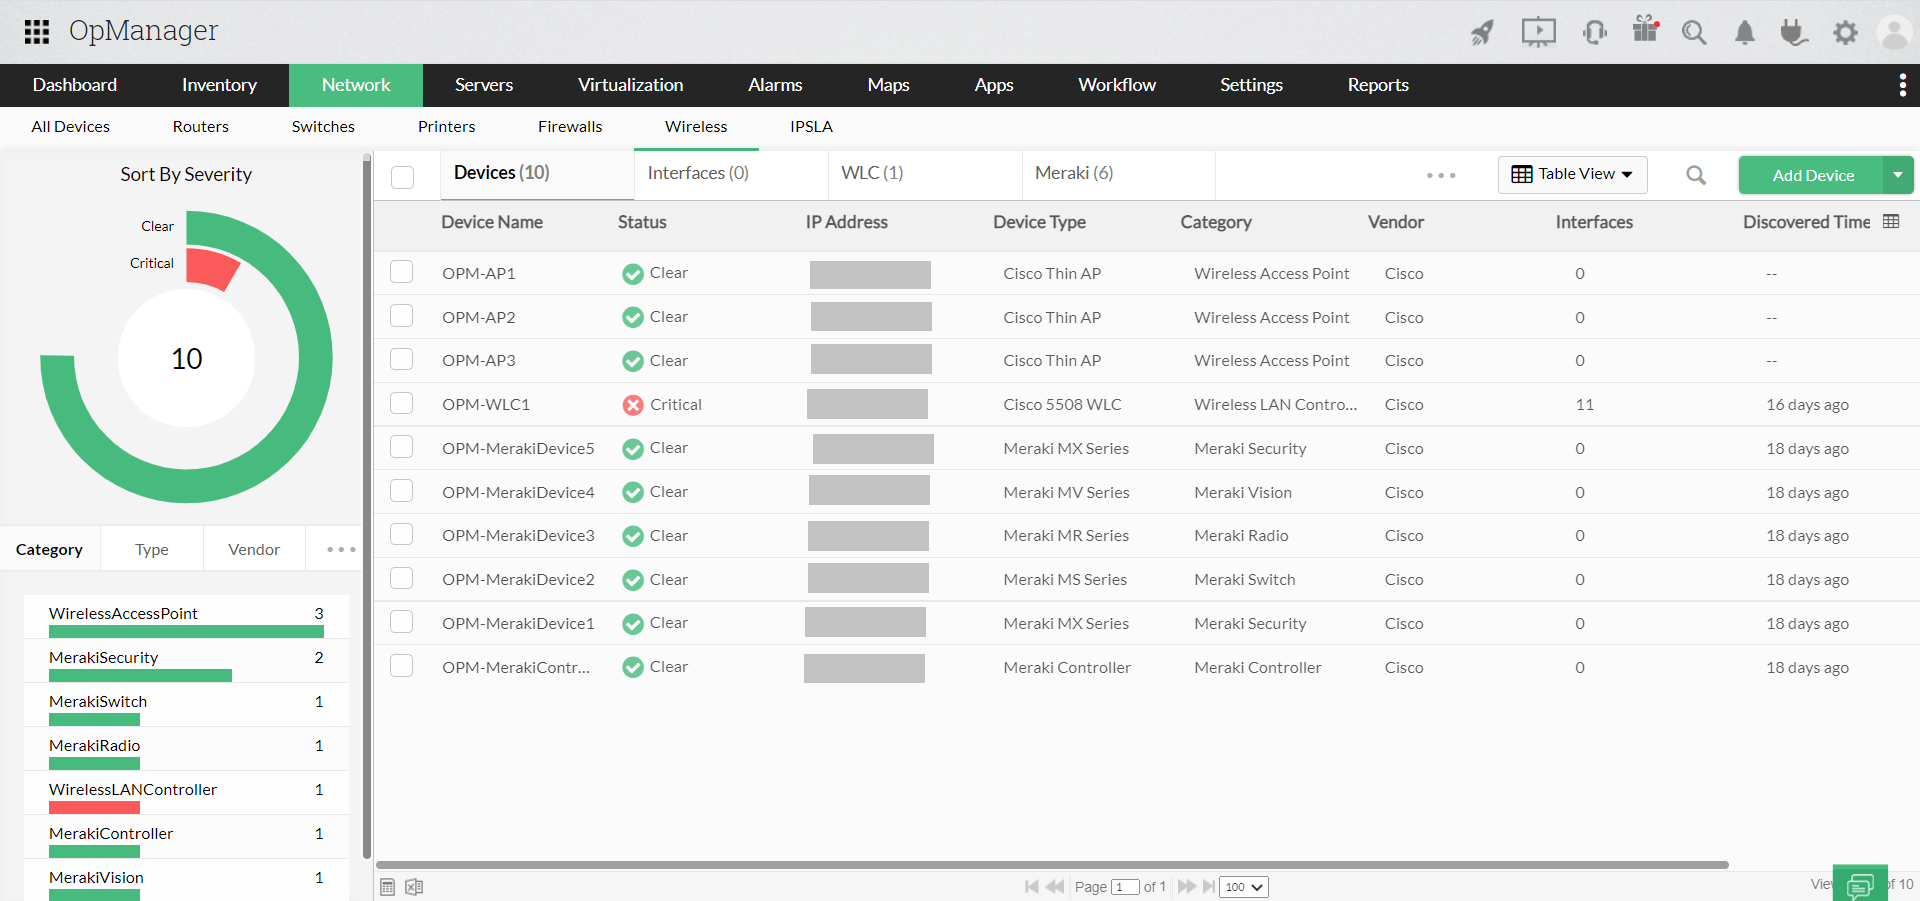
OpManager's Wi-Fi monitor enables you to track key performance metrics of your Wi-Fi environment including signal strength, resource utilization, network traffic, availability, and client count. This helps you keep the health and availability of your Wi-Fi network and its components in check by diagnosing and troubleshooting Wi-Fi issues faster.
You can see how important it is to identify network issues for faster troubleshooting. OpManager is one such tool that helps you with identifying and troubleshooting networking problems. For example, when OpManager alerts you of an application server's CPU utilization, you can:
OpManager saves you ample time and resources when troubleshooting network issues, all while giving you peace of mind. With OpManager, you can also generate systematic reports on multiple aspects of your network, which helps you understand network performance.
OpManager also has handy built-in tools for troubleshooting network issues. These network troubleshooting tools include simple command-line-based troubleshooting utilities that allow for a systematic, efficient approach to network troubleshooting. Some of these network troubleshoot tools are:
Whether it's a critical application server issue or a harmless network blip, OpManager has got you covered. Troubleshooting networking issues have never been easier, download OpManager today!