TraceRoute tool
Troubleshoot network outages as soon as they appear, and even before that with OpManager.
Watch the video to learn how to traceroute effectively
With the growing needs of enterprise networks, organizations are finding it increasingly difficult to monitor and manage their network infrastructure. Network admins are turning to additional tools and resources that could make their jobs a little easier, particularly in regards to troubleshooting.
Currently, network admins largely use simple, freely available utilities like ping tools, Syslog forwarders, and ipconfig to assist their network monitoring and troubleshooting efforts. One of the most crucial tools being used in network troubleshooting is traceroute, and it is widely used to check connectivity and continuity issues within your network. Read through to unwrap everything about the network traceroute tool.
What is the purpose of a network traceroute tool?
In the simplest sense, a network traceroute tool for Windows/Linux is used to check the continuity of a network connection from a source to a destination device. It sends a specific amount of data to your end device and checks if the data transmission occurs without any issues to and from the device. A tool for traceroute can be used for the following purposes:
- To ensure proper connectivity between devices by tracing each step along the transmission path
- To identify network latency or packet loss issues along the path
- To locate faulty configurations that create network loops, resulting in total packet loss
- To accurately identify the source of response delay
Hence, traceroute test tool is mandatory in a network.
How does traceroute work?
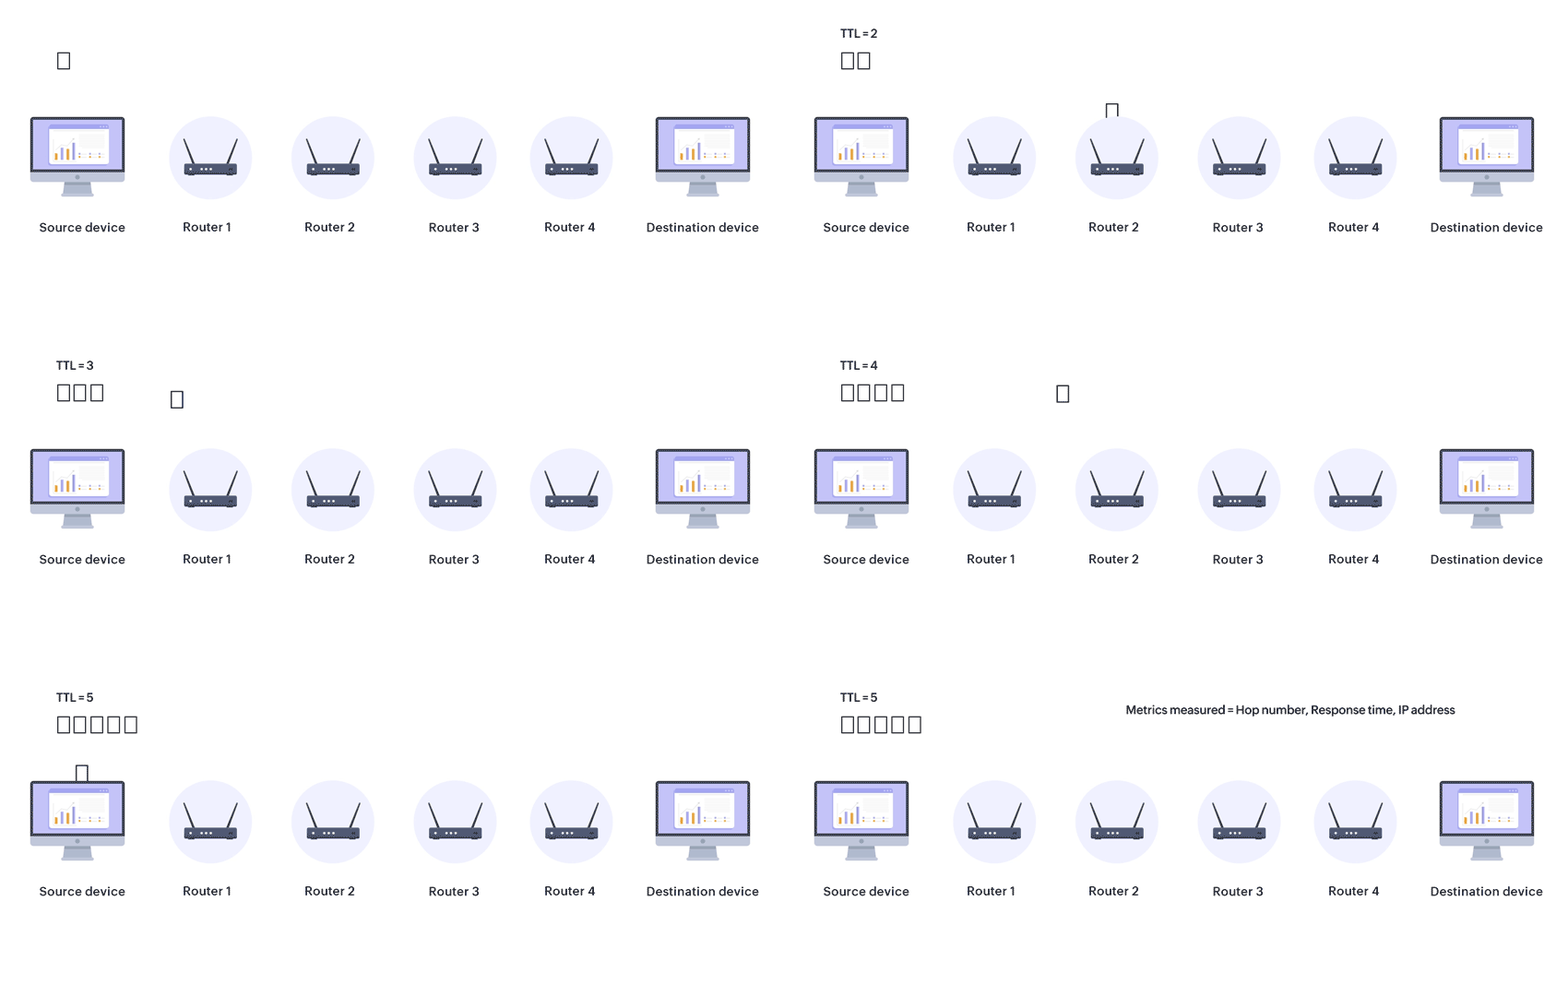
Traceroute analysis is a very simple network operation, but it provides a lot of valuable troubleshooting data for admins. When you run a Windows traceroute tool or Linux traceroute tool, these are the technical actions that are carried out:
- Once a destination IP/DNS is provided and the command is executed, the device identifies the shortest path to the destination and sends four packets of data to the nearest device on the path. This is performed using IPMI protocol.
- The nearest device successfully receives the traceroute request and sends back the four packets. Now the IP of that device is recorded, along with the number of hops to reach that device (one in this case) and the response time.
- The same process is repeated for all devices along the path, with the number of hops progressively increasing as the packets move towards the destination. For each step, all the metrics mentioned above are recorded.
- To ensure that the data is as accurate as possible, each packet is sent to every device a total of three times, and for each attempt, the average response time for the four packets is displayed in the results.
- Once the packets reach the final step, the destination device sends the packets back to the source one last time. Now the device's IP, the number of hops, and the response times are aggregated and displayed in a table, starting from the closest device and ending with the destination device.
- If any packet loss issues were detected on the path, some or all of the corresponding response time values would be displayed as empty. Similarly, if there were latency issues for a device on the path, the response times for that device would be significantly high, which will help you identify the faulty device.
Hence, a dedicated network analysis tool for traceroute capabilities is essential.
How is the TraceRoute tool useful for troubleshooting network issues?
Assume that you are a member of a network administration team for a large enterprise. A few employees working from a remote location have a server on the premises of the organization with critical application data, and this server has been responding very slowly for the past 30 minutes or so, resulting in a poor user experience. This has been reported as critical, and you have been asked to troubleshoot this issue.
In this case, you can initially perform traceroute monitoring of the server from the premises in order to identify local connectivity issues. If no issues show up, you can then try again from an end user's device to find where the response is getting slowed down or lost. By tracing every step along the path, the TraceRoute tool for networking will give you detailed data that will enable you to accurately identify which part of the network is causing the issue. For example, by looking at the individual response times for each hop, the admin can determine which part or device in the network has the highest response times and initiate the troubleshooting actions from that point.
Learn about OpManager's highly potential Traceroute monitoring tool below.
Integrated TraceRoute capabilities with OpManager
With OpManager, our integrated network monitoring solution, you need not look far to make use of traceroute in your troubleshooting processes. The TraceRoute software is integrated into the product by default, and it can be accessed from the Device Snapshot page of any device that has been discovered in OpManager.
With OpManager's best traceroute tool, built right into the framework of the product, your troubleshooting tasks become much easier and more efficient. Simply click the TraceRoute button on the Device Snapshot page, and OpManager will run a thorough traceroute action from the server where the product is installed to the end device and display the critical metrics mentioned above.
The response times from the server to the destination device will be displayed for every device along the path, along with the number of hops. This will help you get a quick idea of the underlying network issues between your end device and OpManager's traceroute tool, as well as where the response times are the highest, thereby helping you identify performance bottlenecks and underperforming devices.
FAQs - Traceroute tool
What is traceroute tool?
+
Traceroute is a network analysis tool used to track the path taken by a packet from source to destination on an IP network in realtime.The tool fetches and displays the response time for every device it pings from the server to the destination device, along with the number of hops and the path using ICMP.
How to do a traceroute?
+
The better way to perform traceroute is to proactively monitor the network for packet loss and network latency using a network monitoring tool like OpManager. With basic information like IP address, and maximum hops, you can run a traceroute with OpManager. The traceroute results will be displayed in the tabular form fetching data for the response times of diagnosed devices.
What is traceroute used for?
+
Traceroute analyzer is used to determine the response delays and identify routing loops in a network pathway across packet switched nodes. Traceroute tool thus helps locate network faults like latency, packet loss, and keeps in check the network connectivity and continuity between the source and the destination device.
Why is a traceroute tool important?
+
Using traceroute analyzer, you can locate where the data was unable to be sent along and also perform a visual traceroute to get a visual representation of each hop. It also helps to locate any points of failure encountered while en route to a certain destination.
TraceRoute tool download
Try our integrated TraceRoute solution as part of OpManager's comprehensive network monitoring software
Download 30-day free trial
Customer reviews
OpManager
OpManager - 10 Steps Ahead Of The Competition, One Step Away From Being Unequalled.
- Network Services Manager, Government Organization
Review Role: Infrastructure and OperationsCompany Size: Gov't/PS/ED 5,000 - 50,000 Employees
"I have a long-standing relationship with ManageEngine. OpManager has always missed one or two features that would make it truly the best tool on the market, but over it is the most comprehensive and easy to use the product on the market."
OpManager
Easy Implementation, Excellent Support & Lower Cost Tool
- Team Lead, IT Service Industry
Review Role: Infrastructure and OperationsCompany Size: 500M - 1B USD
"We have been using OpManager since 2011 and our overall experience has been excellent. The tool plays a vital role in providing the value to our organisation and to the customers we are supporting. The support is excellent and staff takes full responsibilities in resolving the issues. Innovation is never stopping and clearly visible with newer versions"
OpManager
Easy Implementation With A Feature Rich Catalogue, Support Has Some Room For Improvement
- NOC Manager in IT Service Industry
Review Role: Program and Portfolio ManagementCompany Size: 500M - 1B USD
"The vendor has been supporting during the implementation & POC phases providing trial licenses. Feature requests and feedback is usually acted upon swiftly. There was sufficient vendor support during the implementation phase. After deployment, the support is more than adequate, where the vendor could make some improvements."
OpManager
Great Monitoring Tool
- CIO in Finance Industry
Review Role: CIOCompany Size: 1B - 3B USD
"Manage Engine provides a suite of tools that have made improvements to the availability of our internal applications. From monitoring, management and alerting, we have been able to peak performance within our data center."
OpManager
Simple Implementation, Easy To Use. Very Intuitive.
- Principal Engineer in IT Services
Review Role: Enterprise Architecture and Technology InnovationCompany Size: 250M - 500M USD
"Manage Engine support was helpful and responsive to all our queries"
Case Studies - OpManager
OpManager
Industry: IT
Hinduja Global Solutions (HGS) is an Indian business process management (BPM) organization headquartered in Bangalore and part of the Hinduja Group. HGS combines technology-powered automation, analytics, and digital services focusing on back office proces
Learn more
OpManager
Industry: Healthcare
One of the largest radiology groups in the nation, with a team of more than 200 board-certified radiologists, provides more than 50 hospital and specialty clinic partners with on-site radiology coverage and interpretations.
Learn more
OpManager
Industry: Real Estate
Vabi is a Netherlands-based company that provides "real estate data in order, for everyone." Since 1972, the company has focused on making software that calculates the performance of buildings. It has since then widened its scope from making calculations
Learn more
OpManager
Industry: Telecommunication and Media
Bonita uses OpManager to monitor their network infrastructure and clear bottlenecks
Learn more
OpManager
Industry: Businesses and Services
Bonita uses OpManager to monitor their network infrastructure and clear bottlenecks
Learn more
OpManager
Industry : Government
Randy S. Hollaway from Thorp Reed & Armstrong relies on OpManager for prompt alerts and reports
Learn more

 Recognized as a May 2019 Gartner Peer Insights Customers' Choice for Network Performance Monitoring and Diagnostics Software
  Recognised as an April 2019 Gartner Peer Insights Customers' Choice for IT Infrastructure Monitoring Tools.
  Network Management and Monitor Vendor of the Year 2018, 2019
  Entered the 2019 Gartner NPMD Magic Quadrant.
  Ranked #2 in the Infotech Research Software Reviews Data Quadrant 2018.