ManageEngine recognized in the 2023 Gartner® Magic Quadrant™ for Application Performance Monitoring and Observability. Read the report
✕Applications Manager's SQL monitoring covers every component of your MSSQL database server to track down the precise cause of issues that could be hampering its performance. The platform provides insight on sessions, jobs, backup/restore stats, replications, users, configurations, and more. With intuitive reports for performance analysis and lightning speed alerts on performance issues, our SQL monitor can help IT admins identify major SQL database problems to ensure peak performance.
SQL database is one of the most widely used Relational Database Management System (RDBMS) due its multi-functionality that incorporates a ton of features to support software applications better. However, this poses a challenge in identifying the exact instance that could be causing performance degradation as there could be many contributing factors. Some factors that lead to slow SQL database performance are:
Applications Manager tracks each of these attributes to instantly alert you whenever they breach the desired operational range. Our SQL server performance monitor extensively tracks jobs, sessions, backups, replications, locks, and latches to identify the SQL database process which takes too long to execute and causes a delay in the overall response time. It also shines a light on the scan methods that go through tons of unwanted data before getting the desired object. You can also get to know how efficient your cache system is functioning as a hit ratio above 90% is desired to ensure high performance.
In addition to weeding out the components responsible for delayed response time, our SQL monitoring software has a panel that enables you to manually configure each resource to get the best performance output.
The rate at which data can be queried from the SQL server determines how fast the associated application can make itself available to end-users. Whenever there is a delay in querying, it directly affects the performance of the application processes. Queries can become slow due to several factors such as:
Monitor SQL server performance with Applications Manager to make life easier by filtering queries based on CPU time, read/write rate, queue wait time, execution rate, block rate, query plan usage, and memory usage statistics. Based on this, you can identify the slow-running queries, analyze, and optimize accordingly. In addition, our SQL server monitoring dashboard also gives a user impact score to help understand a missing index's impact on server performance and how much room there is for improvement.
Visit our page on SQL performance tuning where you can get detailed information on the parameters used to optimize your SQL database and how Applications Manager helps monitor them.
Ensuring that enough memory is allocated to your SQL database server for cache, replication, query, buffer, and backup can help ensure near real-time delivery of data. However, constant data growth within a cluster poses a huge threat as it could result in memory overload and prevent new data from being written onto the disk. By monitoring data usage, our SQL monitoring tool notifies when it detects threshold breach that allows IT admins sufficient time to allocate memory as required.
The most common connectivity problem that SQL users might face is incorrect login information. In such an event, there might be restricted access as the existing user session will remain as an active connection. This could accumulate and result in an overload of users connected to the database. When there are too many active users, connectivity issues occur that prevent new users from accessing the database cluster.

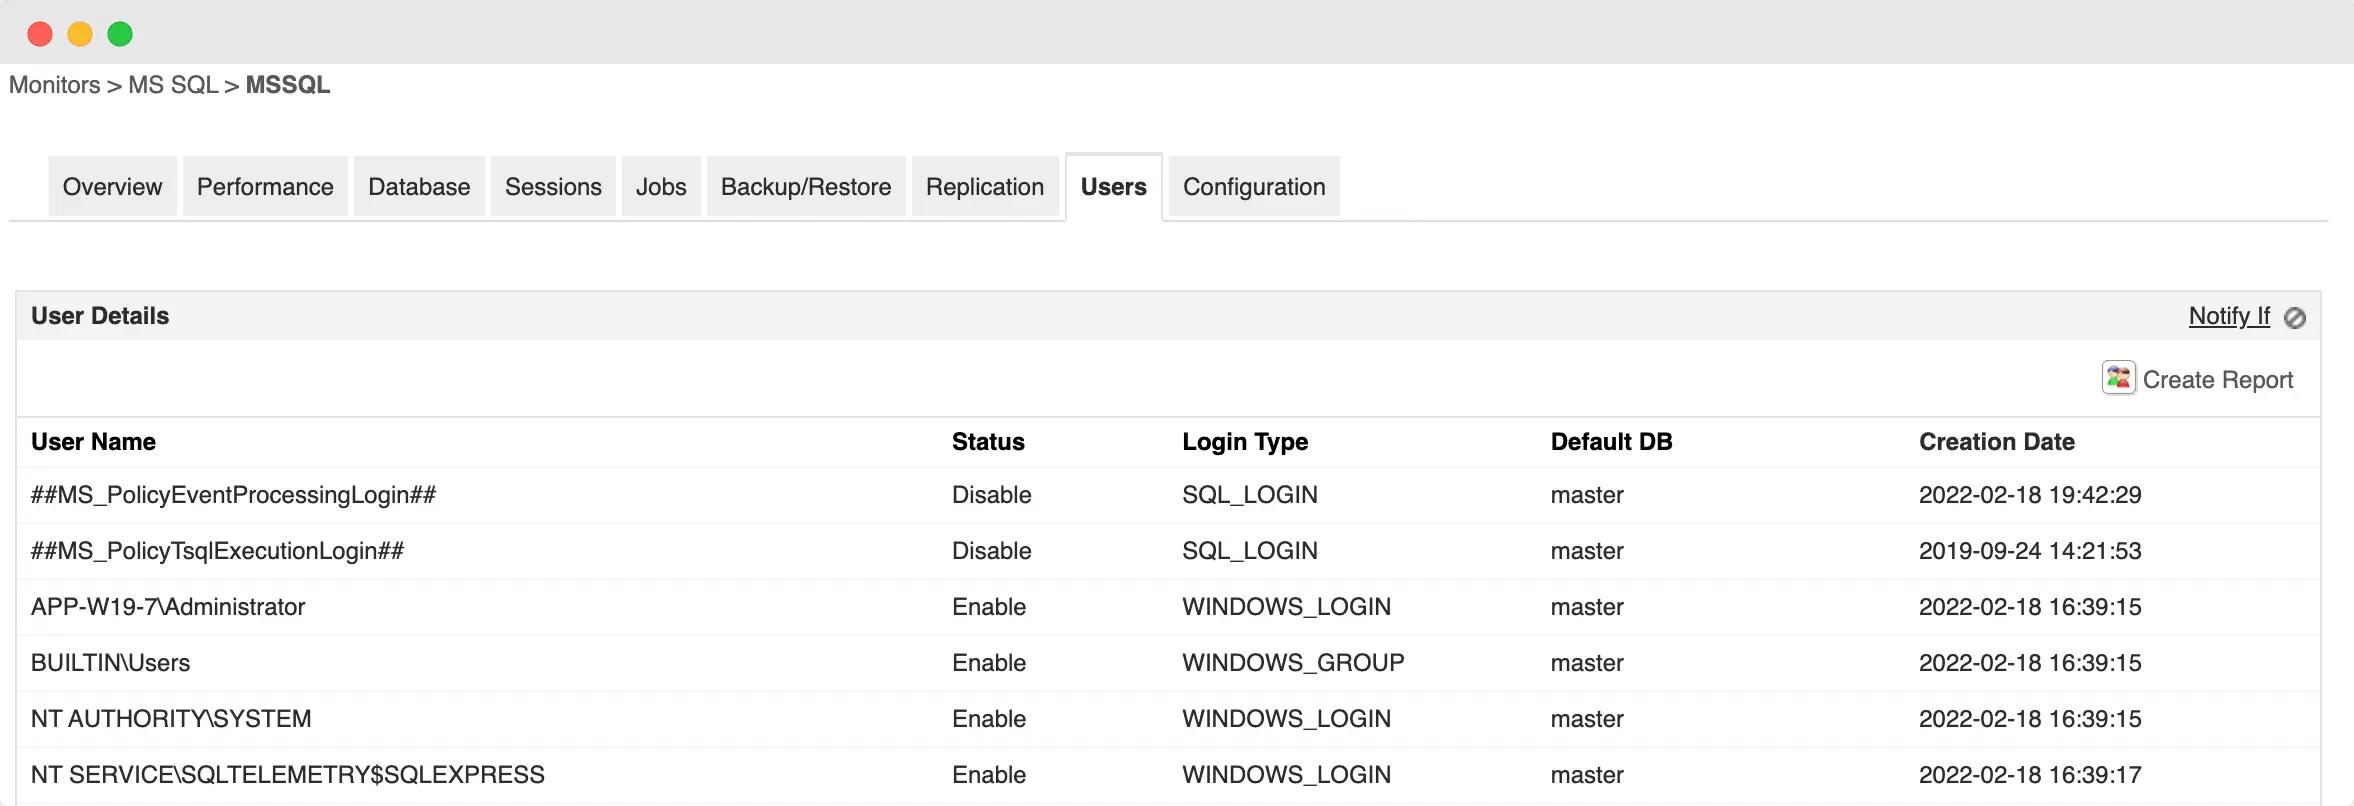
Fortunately, Applications Manager serves as an excellent SQL server activity monitor to track each connected user as well as enable/disable them as required. Covering all the levels of the database, our SQL activity monitor also provides the health status of the SQL cluster, network, individual nodes, sessions, jobs, replicas, backups and restore files, replicas, and availability groups.
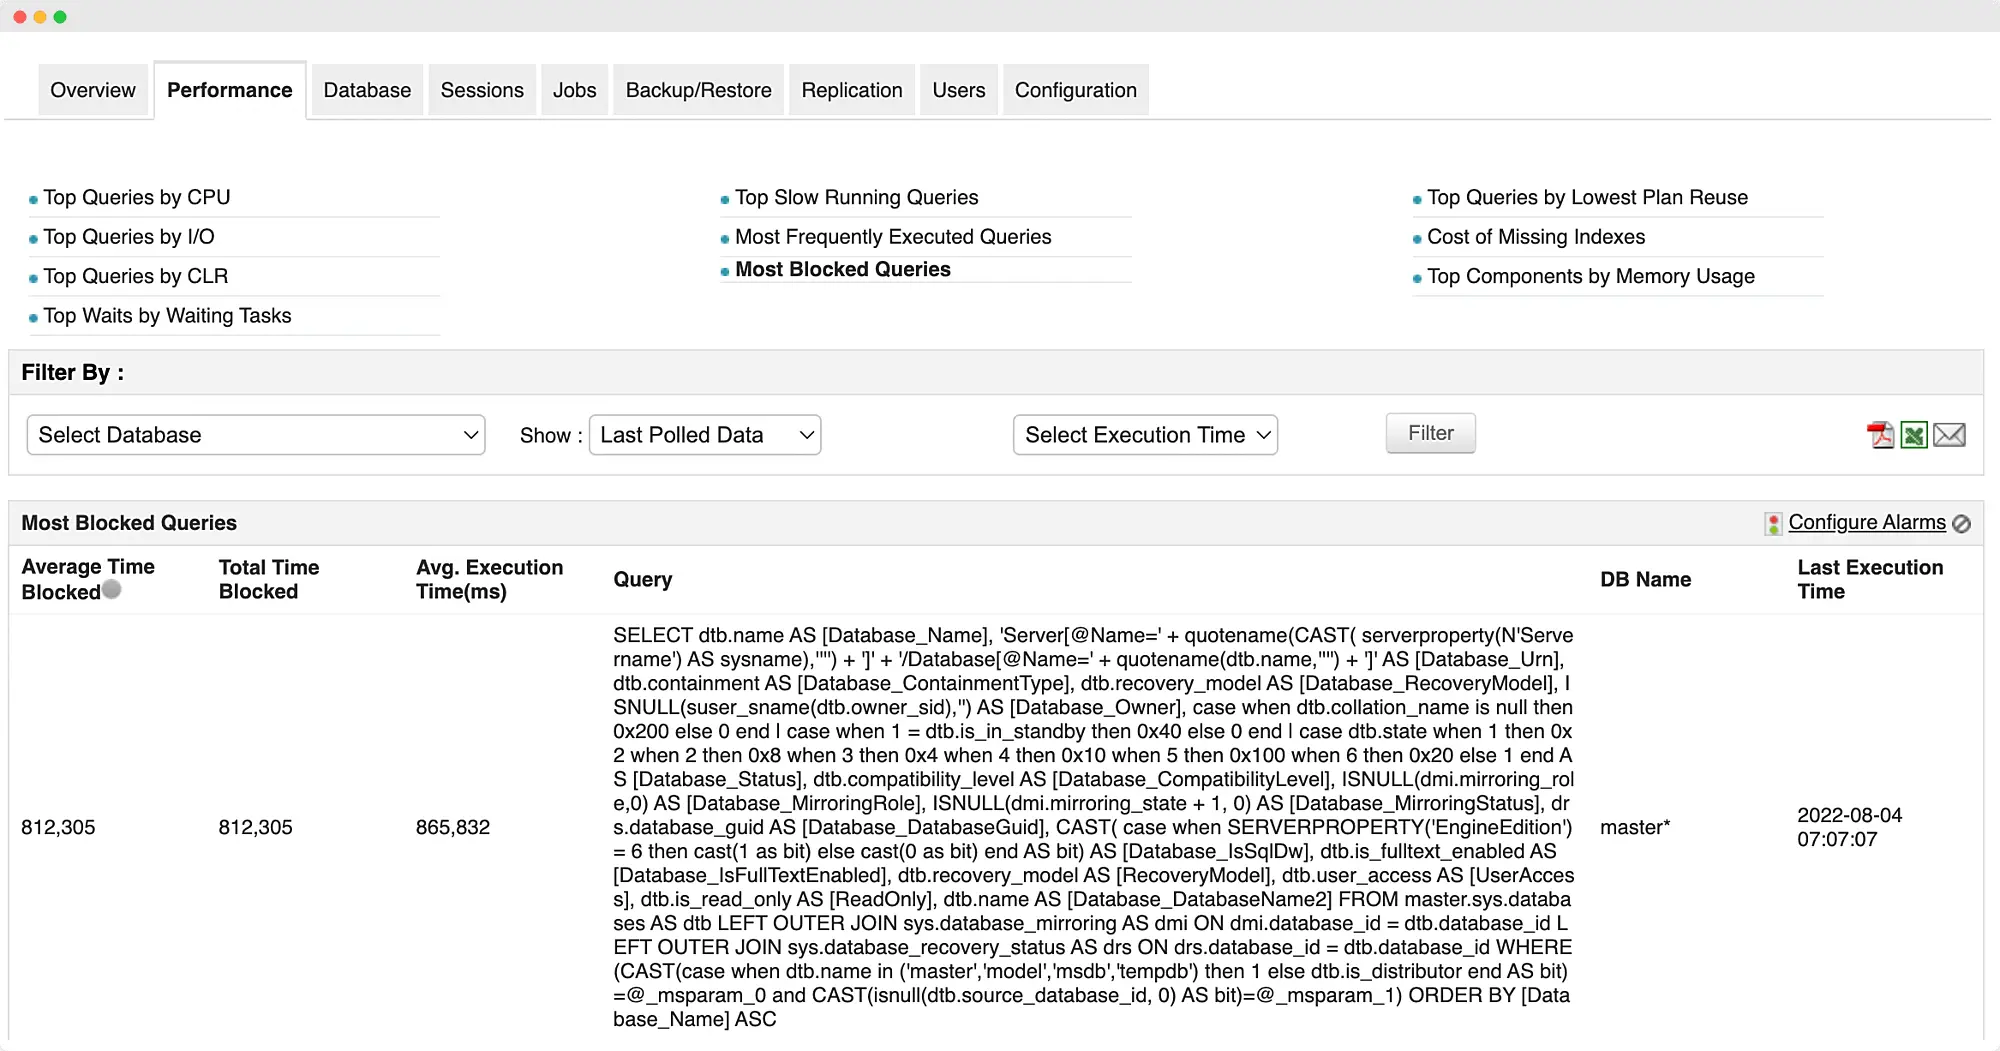
Deadlocks are events that take place whenever multiple transactions are queued up at the same time to prevent conflict in data being written. Similarly, blocks occur whenever more than one session requests a lock to prevent concurrent usage of a resource. Though these act as fail-safe phenomena, frequent occurrence could often result in slow performance.

Our SQL database monitoring capability tracks the transaction, deadlock rate, and block details that can be analyzed whenever there is a hint of performance deterioration. An SQL server performance monitor like Applications Manager also helps pinpoint the queries that take too long for execution. It enables SQL performance monitoring by offering comprehensive details such as total block time, average block time, average execution time, and even the name of the database to make it easier for admins to weed out culprits of performance degradation.
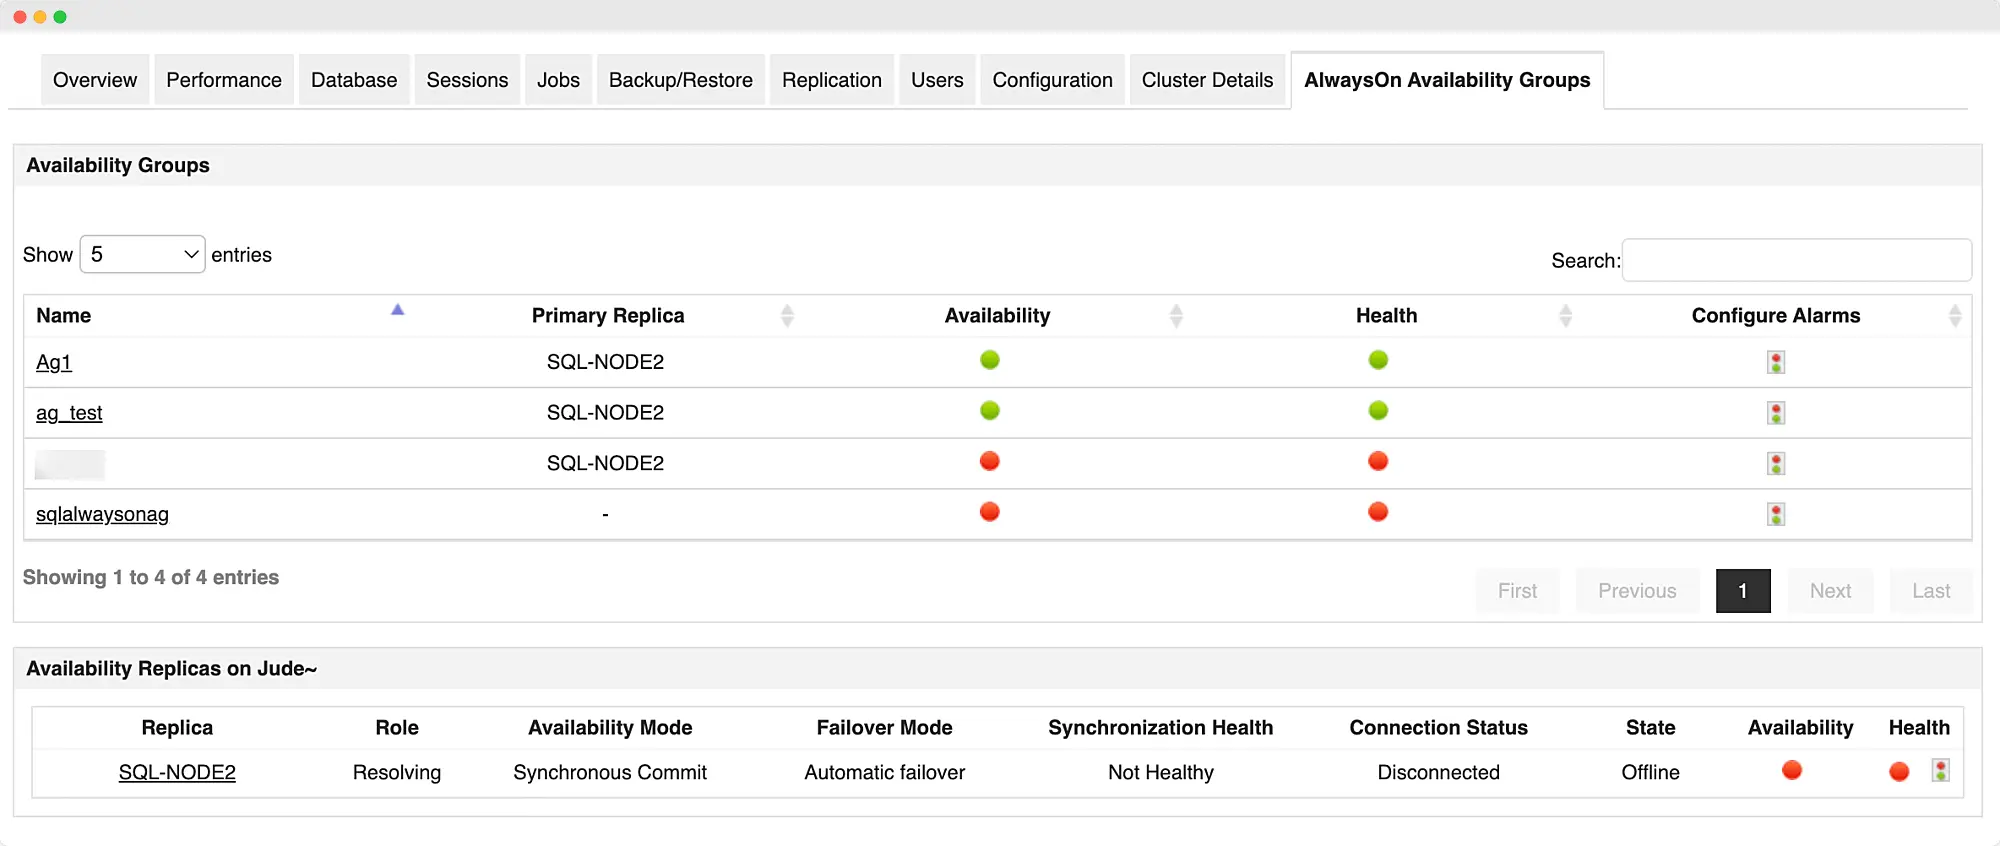
As database failures could come in various disguises, SQL performs a failover where the secondary backup/replica database takes over. In addition, the AlwaysOn Availability Group function helps increase overall availability of the database network. However, in a large IT environment, ensuring round-the-clock availability of the core data storage systems can be quite tedious, let alone the secondary backups and replicas.

To provide visibility into the entire database cluster, SQL monitoring tools like Applications Manager has dedicated panels for each memory subset. It keeps track of the backup's expiry information as well as store and retrieve locations since discrepancies could lead to backup data failure. Similarly, it also checks the synchronization mode of replicas, their data delivery speed and readiness in case of a failover. Monitoring SQL server using tools like Applications Manager makes it possible to keep a close watch on log shipping for ensuring prompt replication of data into the standby server without triggering error warnings.

It allows us to track crucial metrics such as response times, resource utilization, error rates, and transaction performance. The real-time monitoring alerts promptly notify us of any issues or anomalies, enabling us to take immediate action.
Reviewer Role: Research and Development


