Reports

Know your help desk numbers. Stay on top of your IT management.

Reports in ServiceDesk Plus MSP.

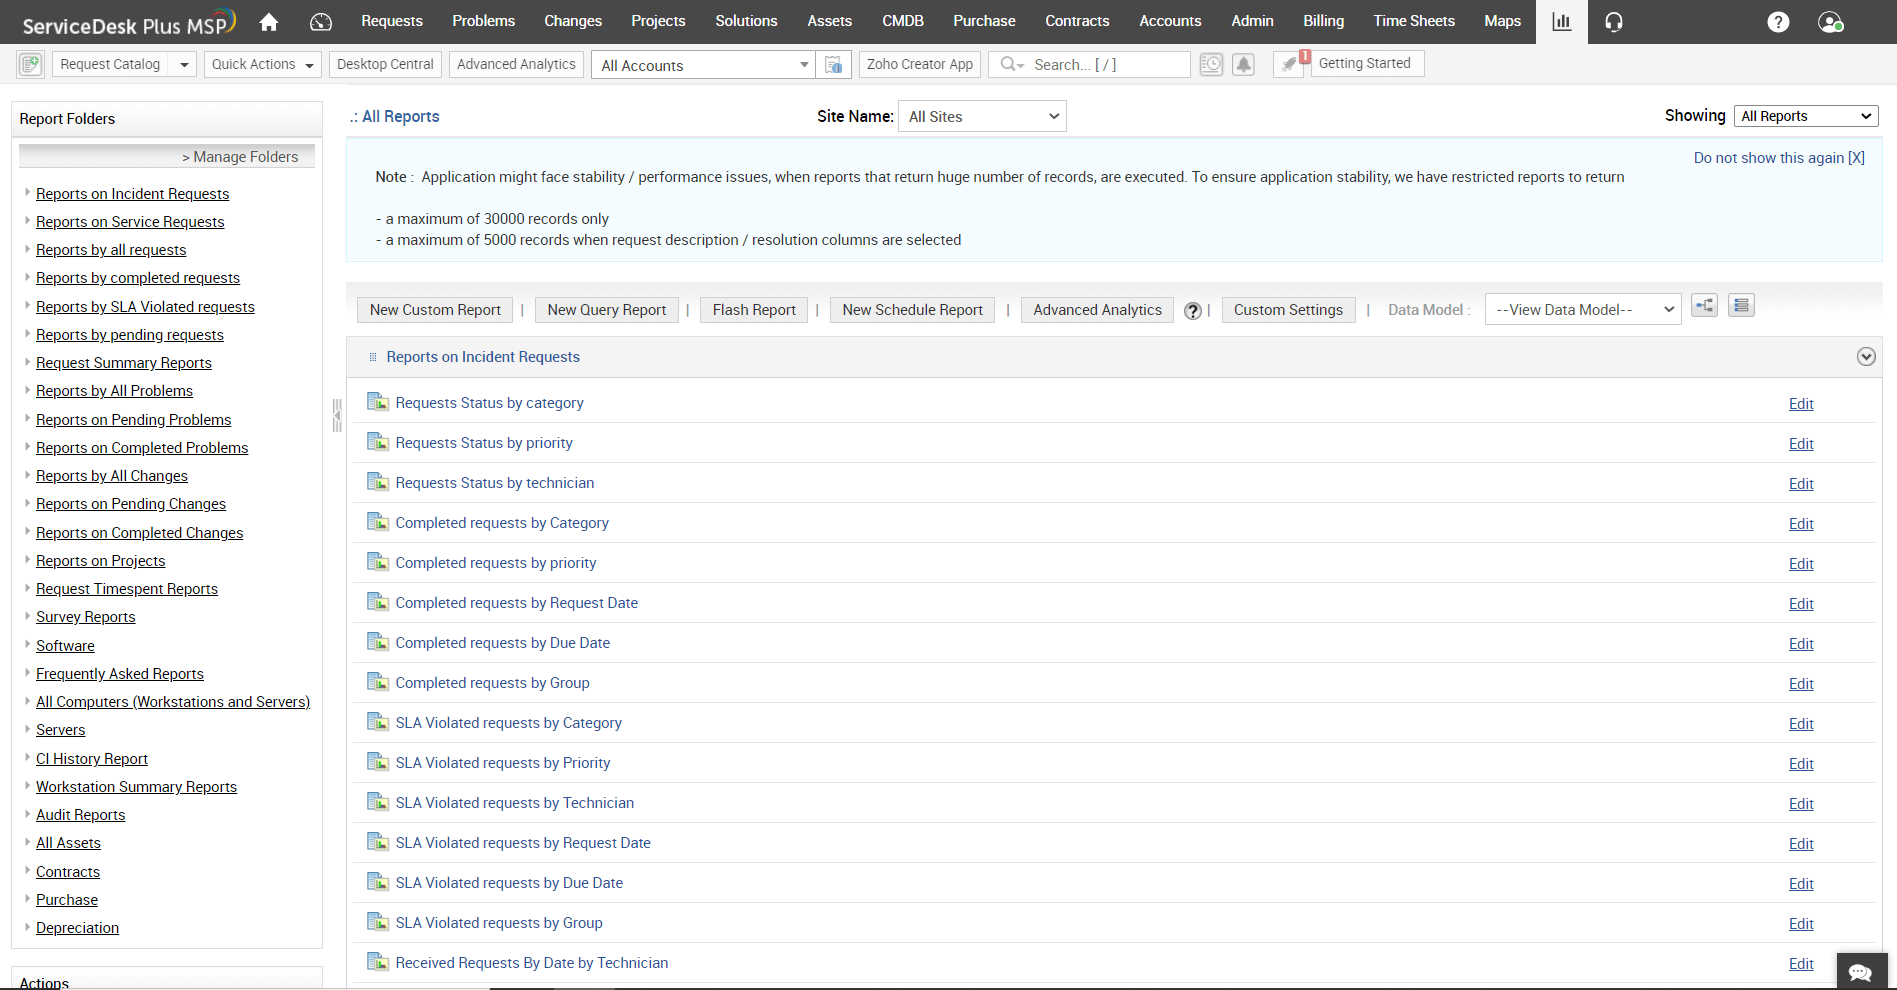
ServiceDesk Plus MSP comes with a set of default reports, as well as customizable reports, to help you gain the help desk intelligence you need to improve your business decisions. When your clientele is widespread and organizations' workflows are complex, keeping tabs on metrics and analyzing business statistics manually is cumbersome.

To free you from such time-consuming procedures, ServiceDesk Plus MSP gives you the most significant data, such as tabular, matrix, and advanced matrix reports, in an easily consumable form. You can take advantage of pre-defined, canned reports or create a custom report that works best for you. Let's take a look at the different kinds of reports you can run with ServiceDesk Plus MSP:

Canned Reports:

ServiceDesk Plus MSP comes with built-in reports, called canned reports, that pull data from all management modules of the application. Canned reports are a one-click solution to your analytics needs and are very handy for generating routine data.

Custom Reports:

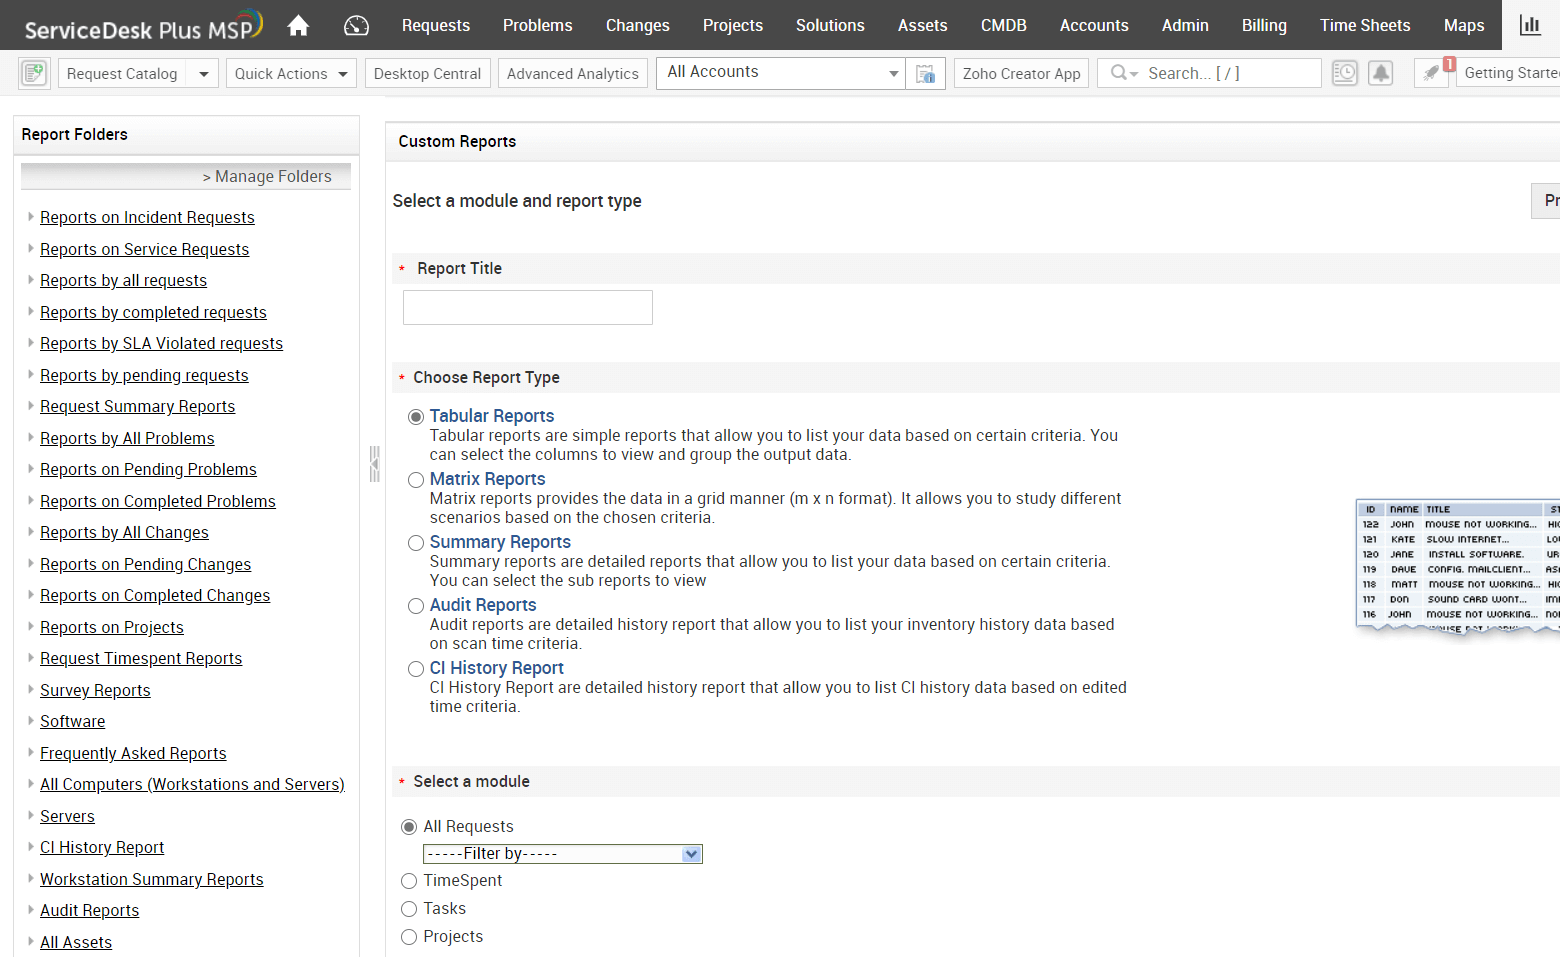
Create personalized reports that cover more specific data analytics with ServiceDesk Plus MSP's custom reporting functionality. Choose the criteria you need to build customized reports that meet your requirements.

Flash Reports:

The flash reports functionality in ServiceDesk Plus MSP includes an interactive dashboard that lets you generate customized reports based on various parameters. It allows you to drill down to deeper and more intricate levels of information, without having to generate separate reports for each parameter.

Help desk analytics

Gain quick insights. Stay ahead of the curve with your service management.

  • Get the best of help desk reporting with predefined reports to analyze your service desk's performance across all modules.
  • View quick reports on tickets based on various parameters, such as requester, technician, request date, category, priority, and more.
  • Generate reports in different formats, such as HTML, CSV, PDF, and XLS.

Create customized reports. Take advantage of data that suits you best.

  • Follow the Reports Wizard's suggestions to create customized reports in a few easy steps.
  • Generate custom reports in tabular, summary, matrix, and audit formats.
  • Visualize derived data as charts or graphs to easily recognize help desk performance patterns.
  • View information the way you like it by choosing which columns to display, adding filters, and arranging and grouping data in the generated report.
  • Save custom reports you create for future use.
Service desk metrics template
MSP report template

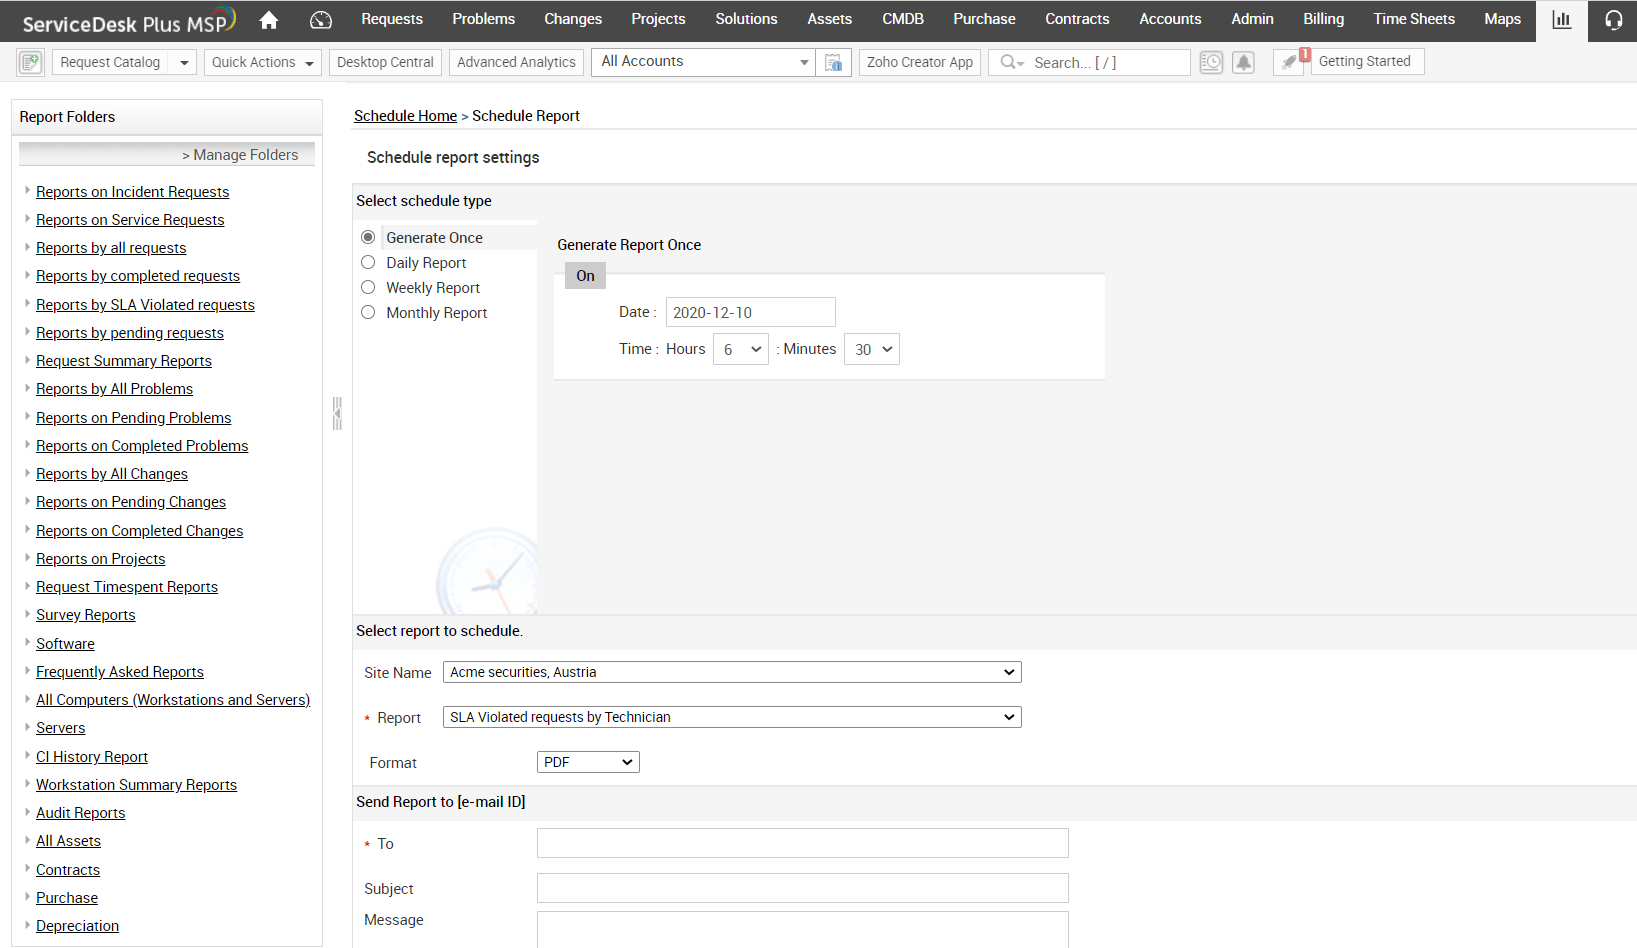
Automate and schedule reports. Say no to repetitive tasks.

  • Schedule both canned and custom reports and send them to stakeholders automatically.
  • Take advantage of the list of schedules you can choose from: daily, weekly, monthly, or one-time schedules.
  • Choose a format for your report, then select recipients from an existing user database.
  • Receive and view scheduled reports in your inbox without logging on to the application.