ManageEngine recognized in the 2023 Gartner® Magic Quadrant™ for Application Performance Monitoring and Observability. Read the report
✕Applications Manager performs Python monitoring by collecting various performance metrics and converting them into useful insights that can be used by IT administrative teams to make enhancements and optimizations. Being an interpreted language, it becomes critical to have round-the-clock visibility into your Python application platform to prevent performance bottlenecks and instances of application crash.
Applications Manager's Python monitoring tool keeps a close watch on every component of your application, allowing DevOps teams to immediately response to performance issues preemptively before end-users get affected. This becomes especially critical when dealing with CPU-intensive workloads where it is possible to be unaware of performance degradation that occurs behind closed doors. This makes it essential to employ a Python application performance monitor like Applications Manager which can instantly throw an alert to the respective teams and perform automated actions accelerate the troubleshooting process.
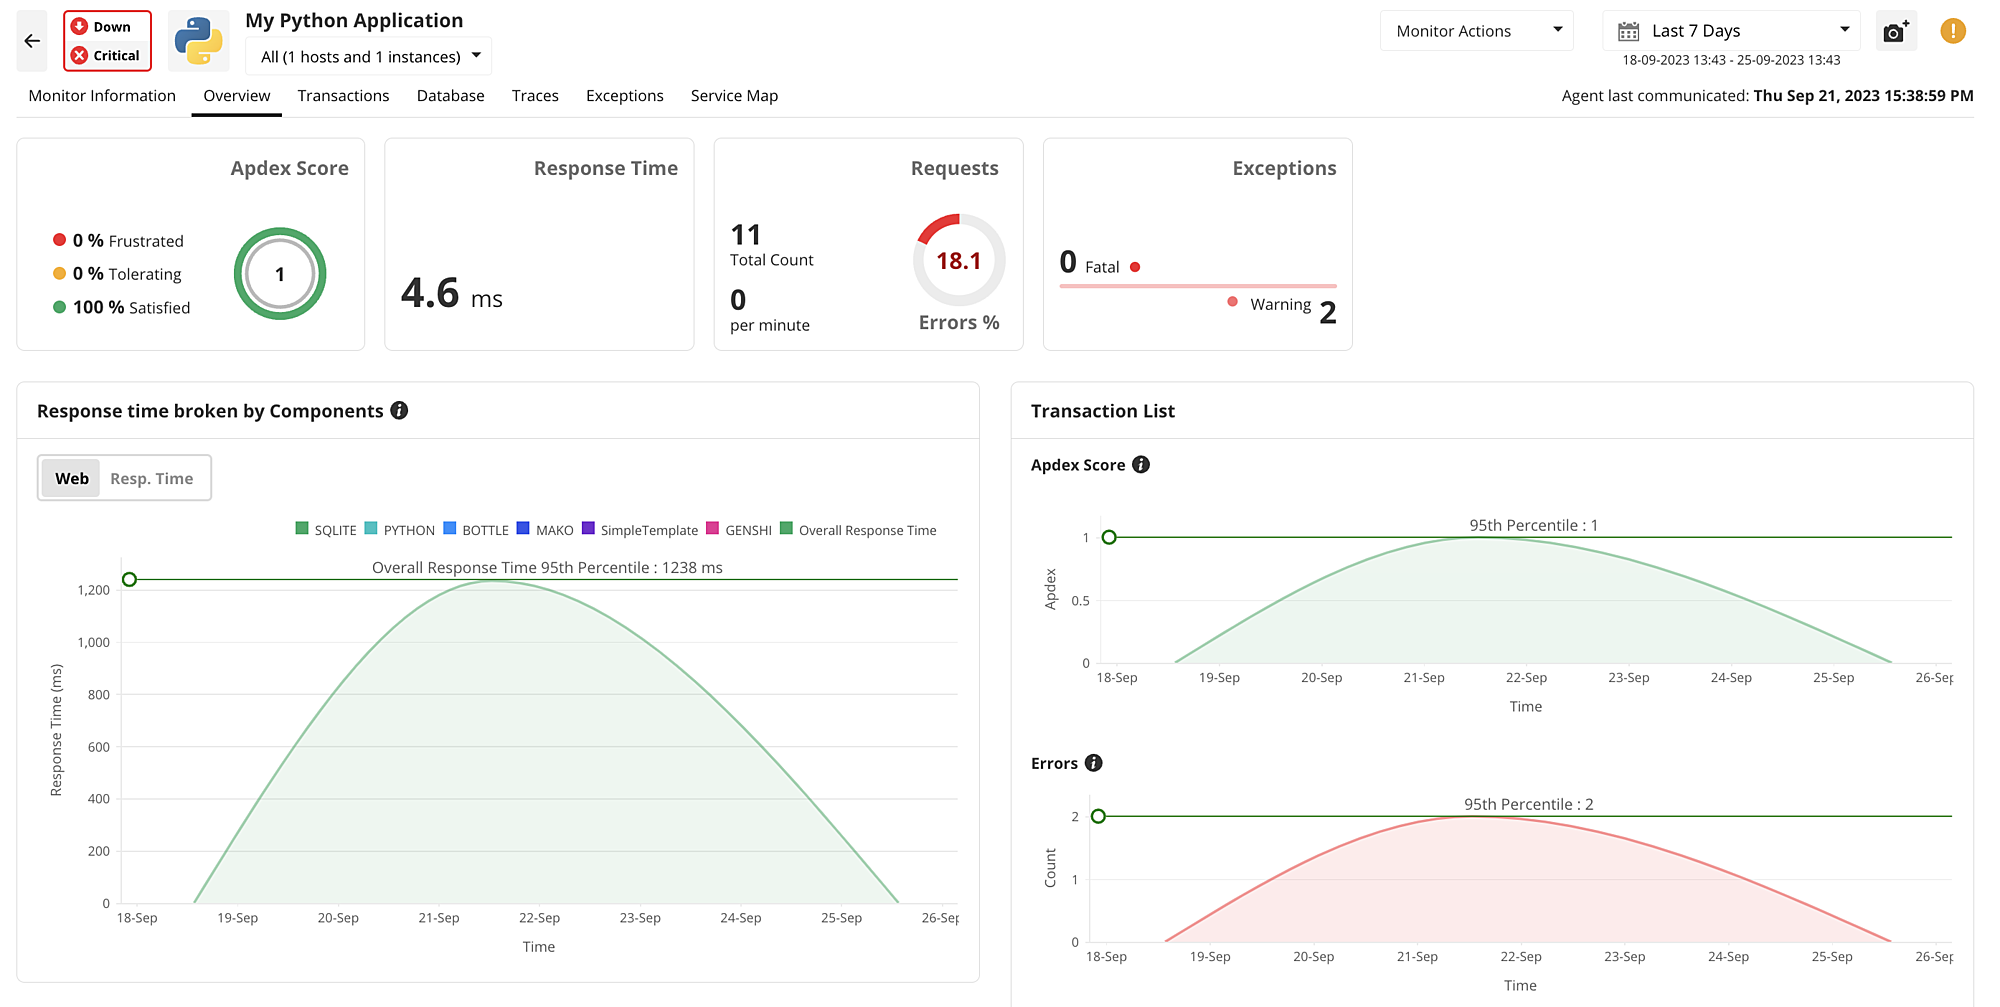
Applications Manager features a visual performance dashboard that gives an overview of all the critical metrics that are necessary to understand the exact point where an issue originates from. It also gives the Apdex Score of your Python applications which can help understand the satisfaction level of an end-user. In addition, it breaks down the response time of application components and isolate the exact point where severe latency issues occur. At a glance, IT teams can get a list of the slowest transactions and traces that require attention without having to go through an entire heap of code.
Applications Manager offers complete visibility into your Python application stack by monitoring all the database operations and the effects that their response rates would have on the transactions traces. It breaks down each database operation to give the response time, request rate, error percentage, and throughput within a single console.
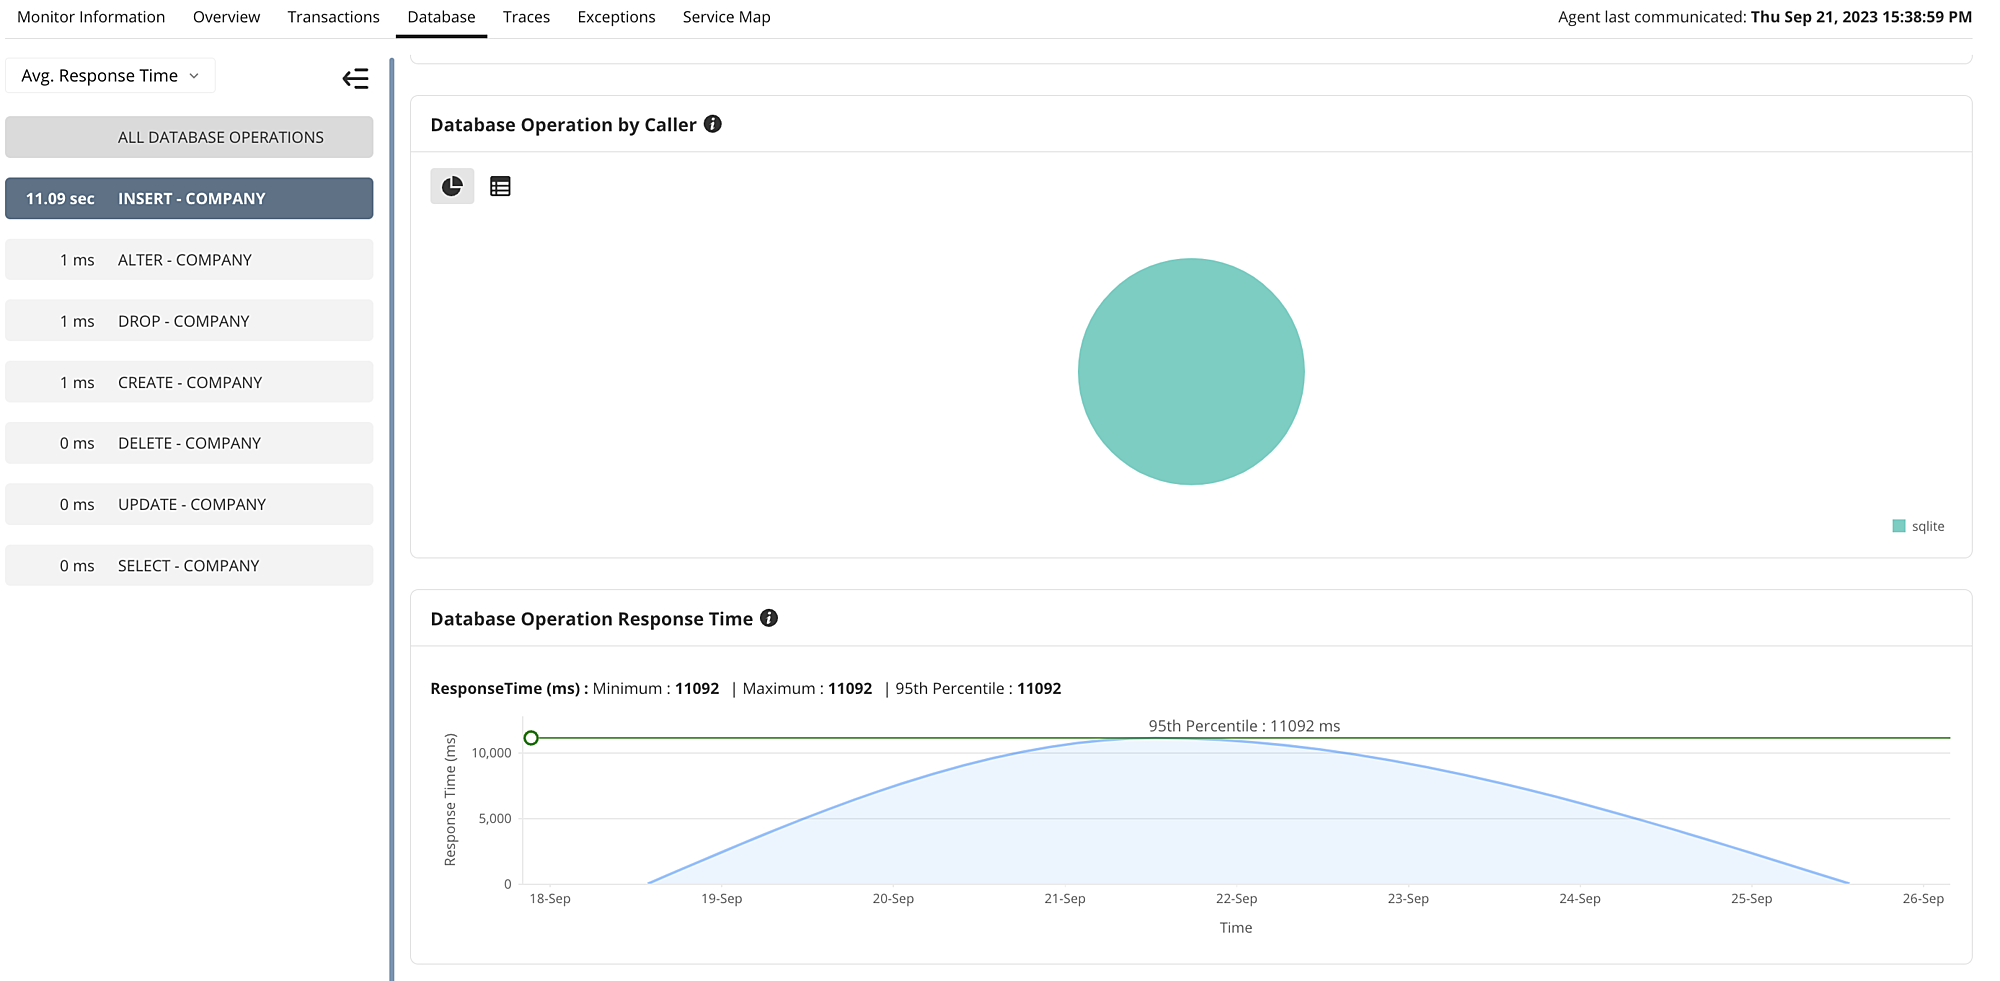
Our Python application monitor also lists out the slowest traces involved with the database operation, making it easier to identify the one that takes too long to execute and optimize them for better Python application performance.
Through Applications Manager, it becomes possible to sort out transactions based on different performance metrics to isolate the ones that are performing poorly and require immediate attention. Using performance graphs, IT administrators can have better visibility into each component of their Python application and identify fluctuations that could potentially translate into performance bottlenecks. Once the exact application component has been identified, our Python monitoring software can be used to drill down into each component or trace for further insights.
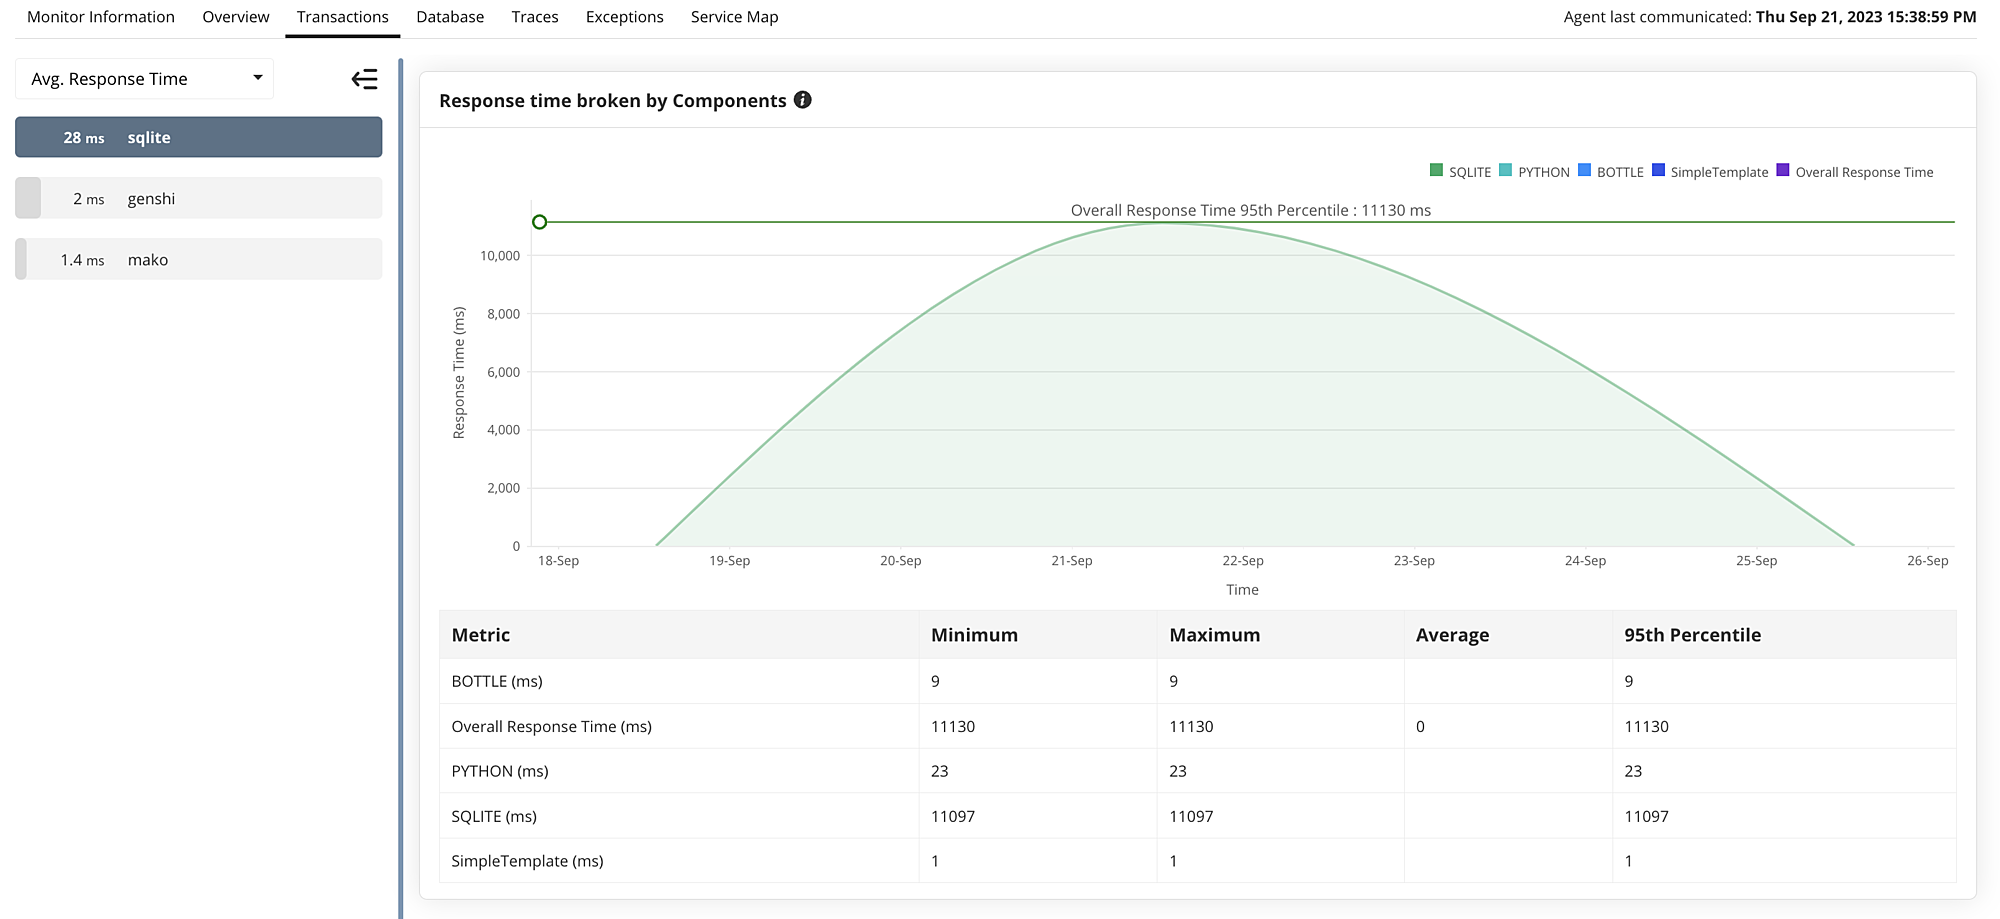
Some of the metrics that help achieve visibility into transactions include response time, error codes, exceptions, throughput, and more.
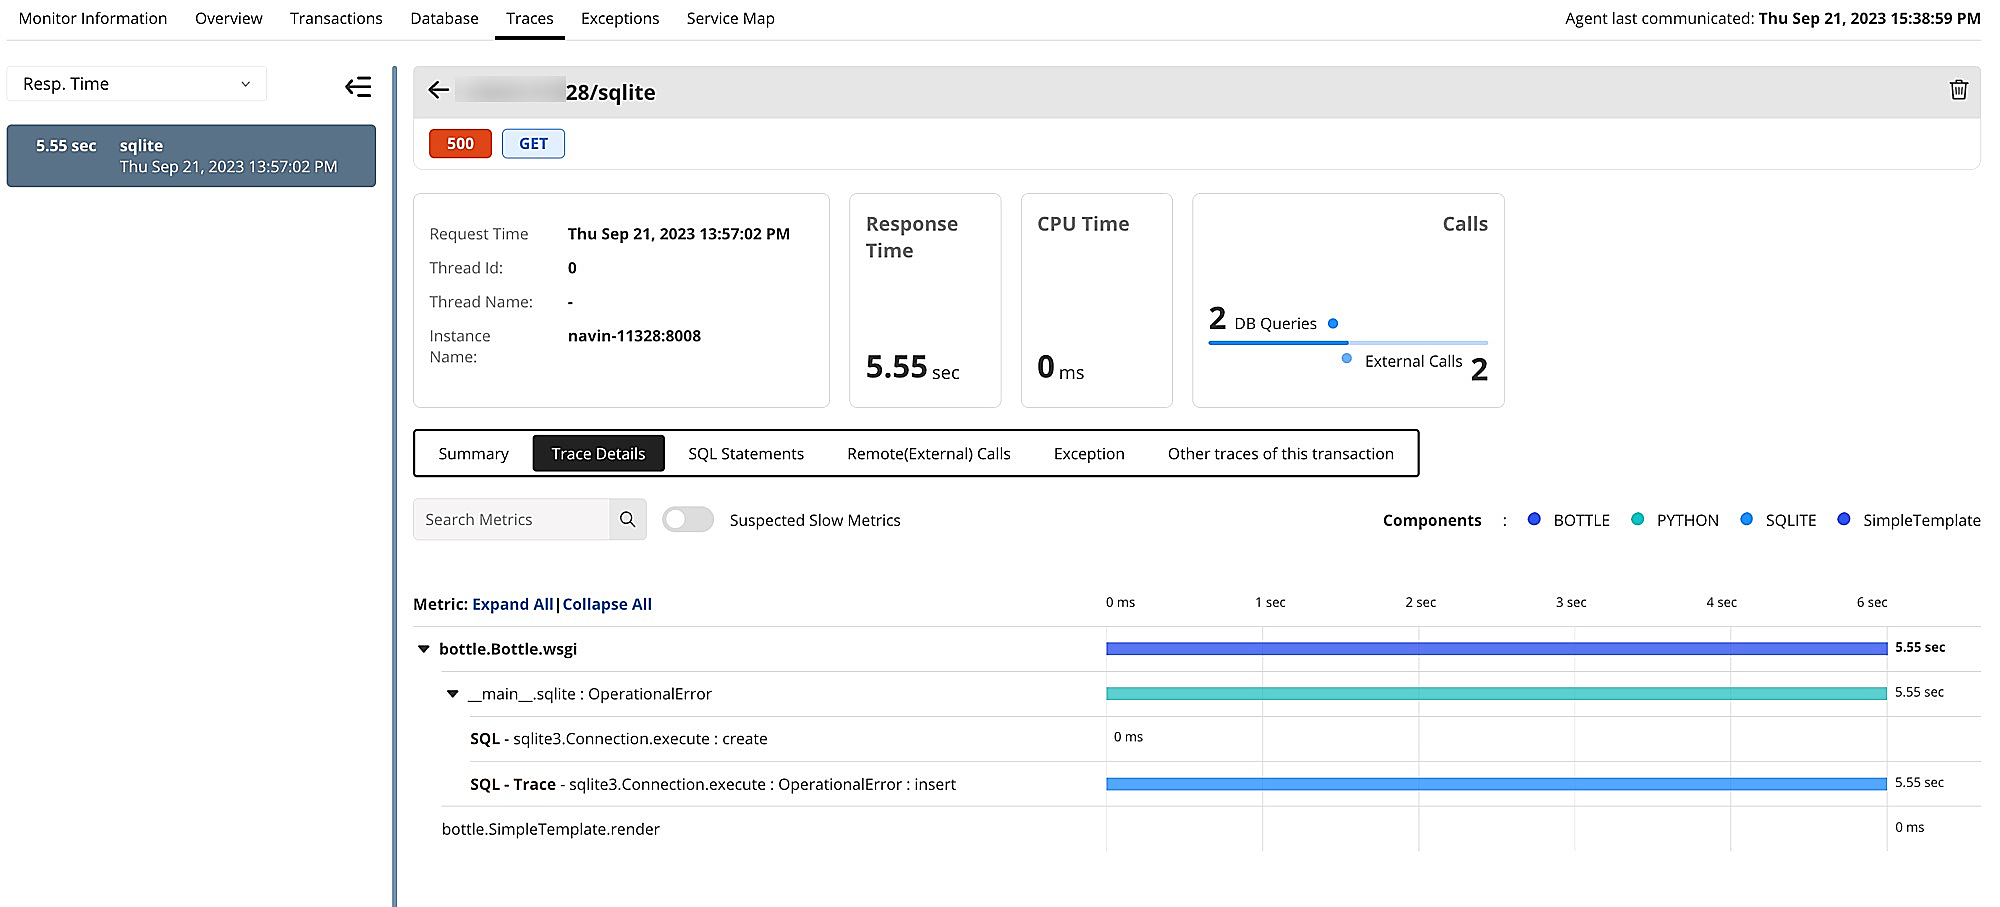
Applications Manager supports distributed tracing that tracks the entire path that a request ventures through to execute an application operation. This capability grants granular visibility into your application's code path to identify the error and latency of your Python services. By simply applying a toggle, Applications Manager highlights the slowest traces that are involved with the transaction, revealing the origin point of the performance bottleneck. Furthermore,it also tracks the response time of each SQL statement to help understand the statement that takes too long to execute its task.
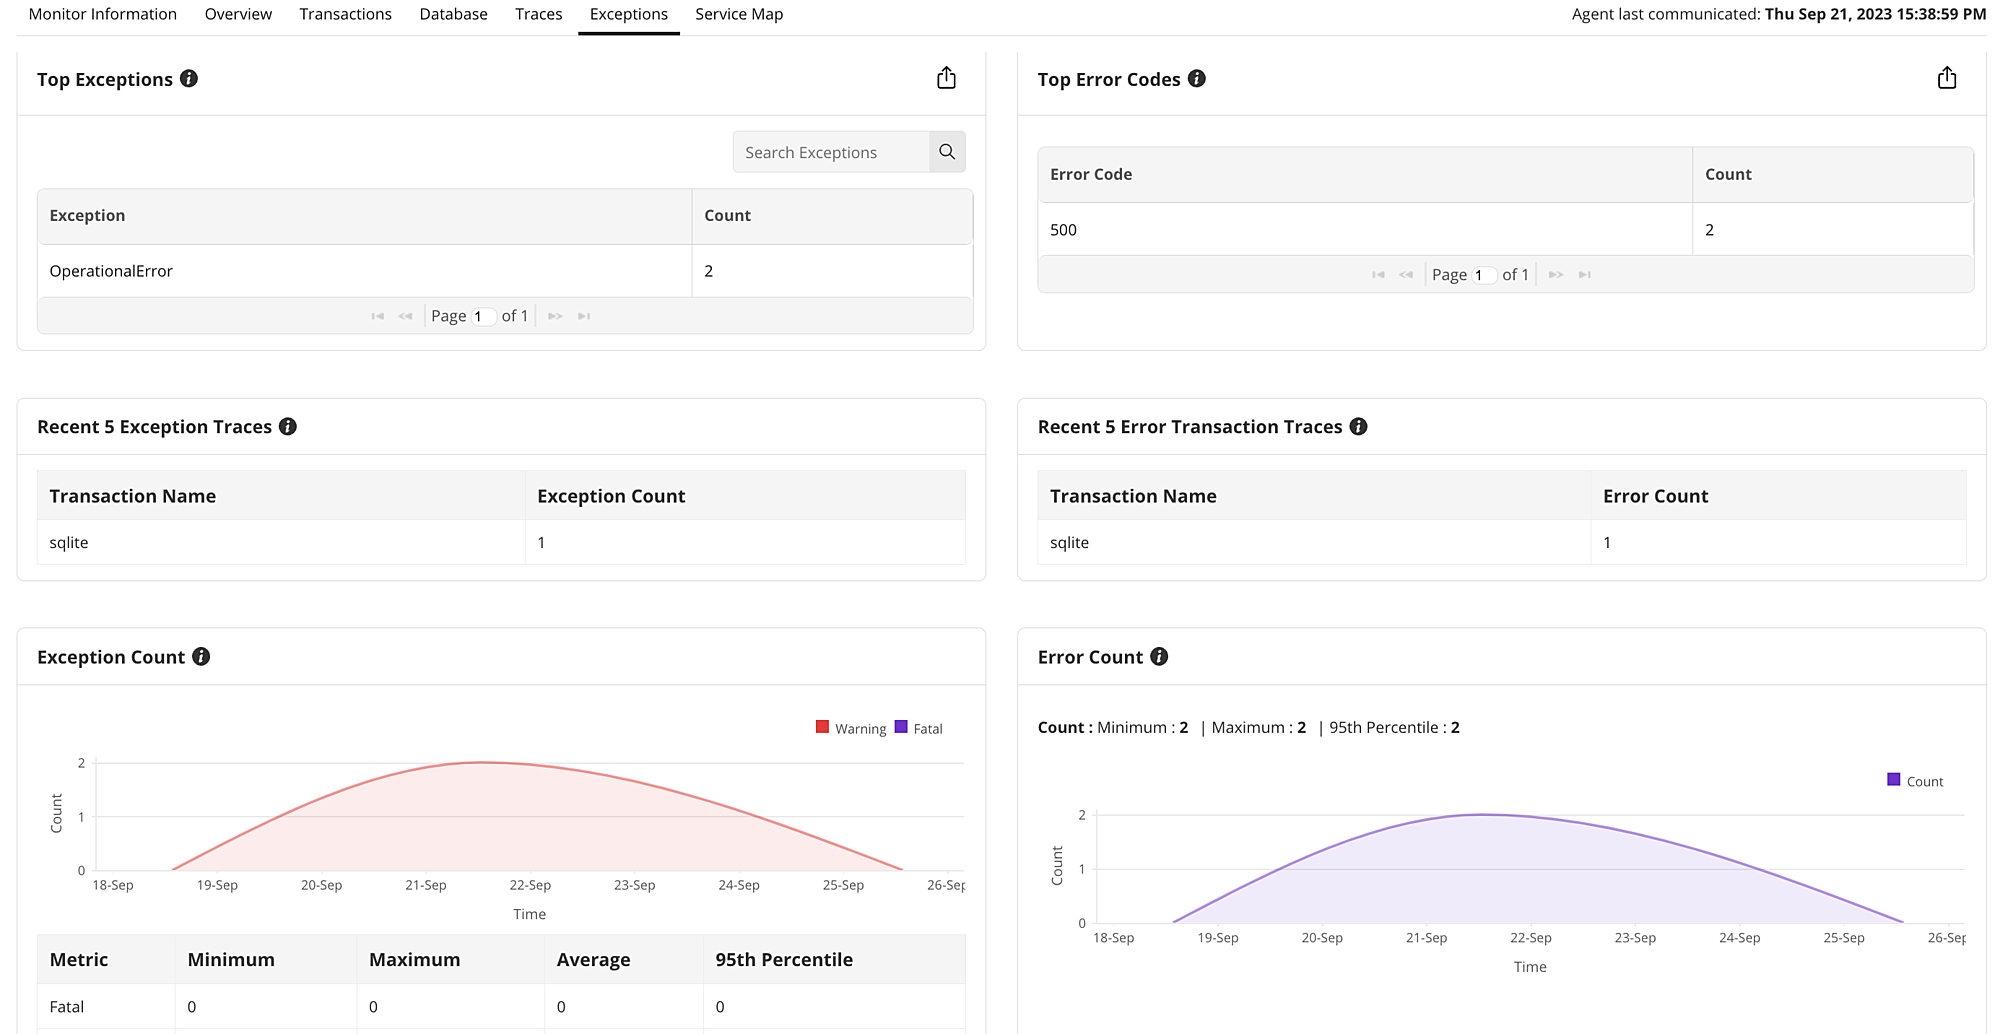
Within the console of our Python monitoring solution, there is a dedicated Exceptions panel with a detailed breakdown of the all the parameters related to errors and exceptions. In addition to tracking the error codes of your Python application, Applications Manager also alerts you whenever the count of each code exceeds a certain limit. It monitors the different exception error types that your Python application would be prone to. It also gives a split up of the exceptions and error for each transaction that allows quicker debugging without affecting the performance of your Python application.
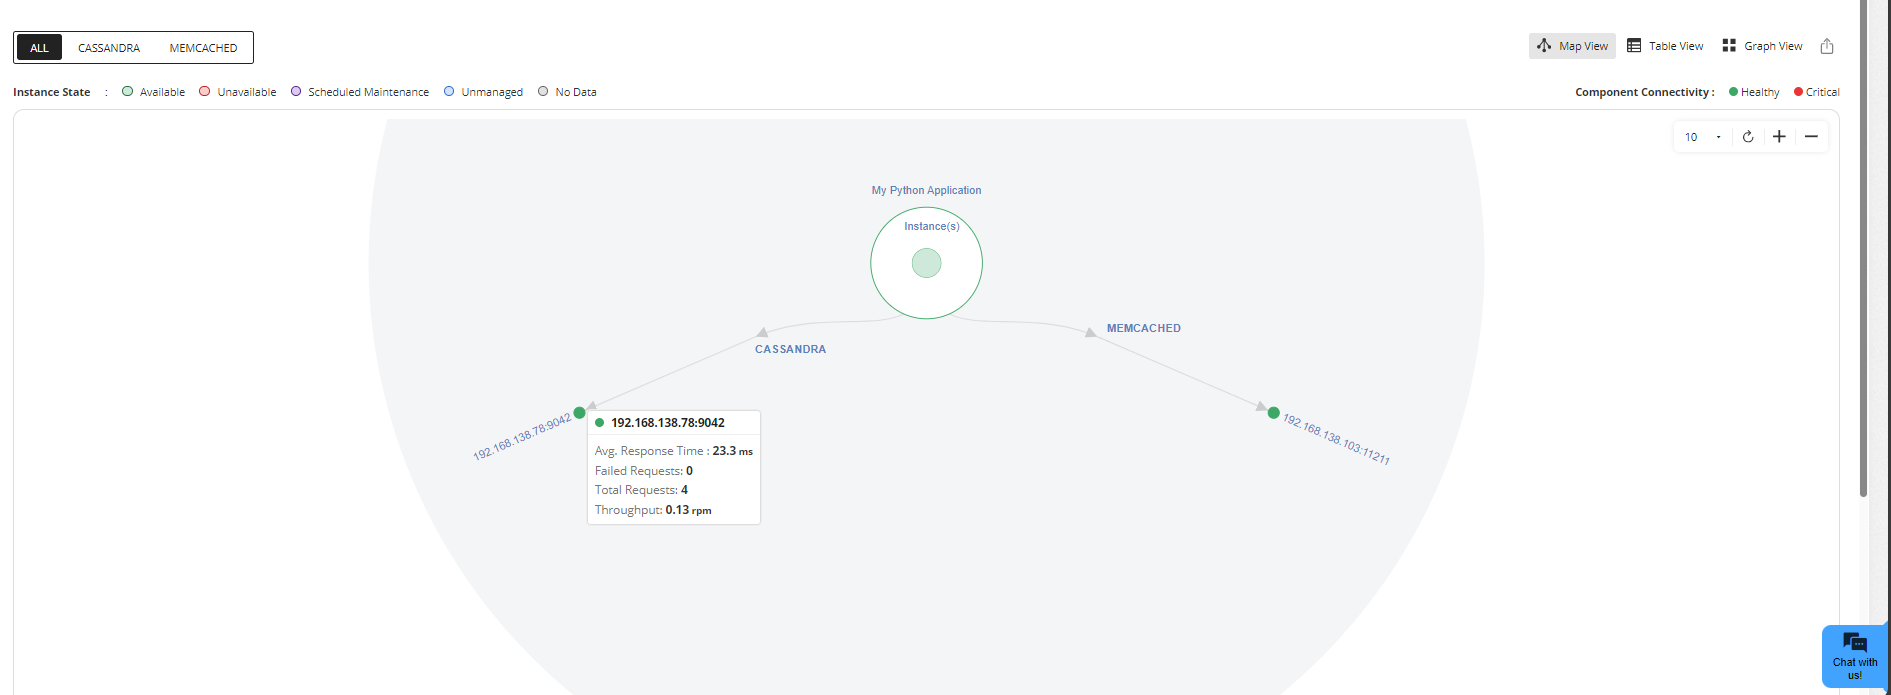
Featuring a customizable service map, Applications Manager makes it possible to group all the dependencies of your Python application and draw a correlation across them. As most business-critical applications deal with innumerable amount of dependent services, the mapping functionality gives more clarity into the exact component that has become unavailable. With the aid of this functionality, one can easily trace the dependent components that are affected by the unavailable Python application service without having to contact individual IT administrative teams manually.
ManageEngine Applications Managers serves a one-stop solution for all your Python application monitoring needs with the granular visibility into tons of critical performance metrics. To explore all the features of our Python monitor, try out a 30-day free trial of Applications Manager now!

It allows us to track crucial metrics such as response times, resource utilization, error rates, and transaction performance. The real-time monitoring alerts promptly notify us of any issues or anomalies, enabling us to take immediate action.
Reviewer Role: Research and Development


