We thank you for installing ManageEngine OpManager - an easy to install, easy-to-use, affordable network and server monitoring software.
OpManager can now be integrated with Microsoft Teams, a powerful business collaboration tool. Using this integration, network admins can send alerts from OpManager, to the concerned channels in Microsoft Teams. This speeds up the fault rectification process, thereby ensuring high service uptime. Learn More.
With the upgrade to OpManager version 126116, users can configure SHA-2 algorithm for SNMPv3 authentication to ensure better security for network monitoring.
OpManager's new relationship sync feature allows users to sync Layer2 Maps to SDP OP CMDB and SDP OD CMDB while integrating OpManager with SDP OP as well as SDP OD. Enabling sync operation automatically builds CI relationship in CMDB. Hence users can now easily have a high level view of the network that further helps them with the impact analysis of the alerts raised.
OpManager's all new Root Cause Analysis feature enables you to visualize, analyze and correlate IT monitoring data of your devices, interfaces and URLs in a centralized console and accelerates the process of identifying the root cause of network issues.
With the Secured Assertion Markup language (SAML) authentication, users can enable single signon in OpManager and avoid using multiple login credentials.
OpManager now offers a in-house Network Path Analysis tool to visualize and continuously monitor your network path's performance, route pattern, overall path history and helps you identify any communication delays between the source and destination.
The Adaptive Thresholds feature enables users to optimize the efficiency of alerts, by dynamically modifying the threshold values for critical monitors using OpManager's Machine Learning-based predictive algorithms. This eliminates the need for manual intervention with deciding thresholds, and fully automates the process of studying complex datasets and arriving at feasible threshold values for each monitor.
With the upgrade to version 125415, users can configure TFA in OpManager and improve security. TFA requires users to enter a time-based OTP generated via authenticator apps to verify the credibility of the user.
The Agent-based monitoring feature allows you to scale your network monitoring capabilities across huge enterprise networks by installing a small "agent" software in your critical devices, enabling near real-time alerts and monitoring and also allowing OpManager to use available network resources more efficiently.
Proactively monitor the health and traffic across your VPN tunnels with OpManager's new VPN monitoring feature. OpManager supports prominent leaders in the VPN infrastructure market such as Cisco, Fortinet, and Watchguard right out of the box.
By adding your IPMI-compatible devices into OpManager using a dedicated IP address, you can monitor critical hardware metrics of your devices independent of its availability using the IPMI monitoring feature in OpManager.
Discover your whole Cisco ACI infrastructure and get a comprehensive view of your controller along with all the other components, such as the fabric, tenants, and endpoint groups. This serves as an unified tool to track the health and efficiency of the entire ACI environment and its associated components.
OpManager offers a complete all-inclusive inventory for your Cisco Meraki Organization. Monitor all associated entities including Meraki Security (MX), Meraki Switch (MS), Meraki Radio (MK), Meraki Cellular Gateway (MG), Meraki Vision (MV), access points, SSIDs, clients, nodes, and ports.
OpManager now supports Cisco switch stack monitoring for versions 125300 and above. A combined interface with a unified SNMP/CLI view, dedicated reports and personalized alerts is provided for all units in a stack that is discovered in OpManager.
OpManager's multi-vendor WLC monitoring module keeps your network intact by providing in-depth visibility of your wireless LAN controller (WLC) and helps you monitor the overall performance of your wireless network and its associated entities. Advanced monitoring of the SSIDs and access points can also be enabled for better monitoring and complete control over your network.
AD based discovery allows you to import and discover devices in your domain into OpManager at once. This saves a substantial amount of time and also decreases the chance of overlooking devices in your network. By default the AD discovery page will list Domain name and Domain Controller name of the OpManager installed server machine. The user will have to type in the username and password to connect to that domain and then discover those devices into OpManager.
The Groups feature in OpManager allows you to collect a bunch of devices or interfaces together for a more organized network infrastructure. Bulk actions such as associating notification profiles or monitors can be performed at once for these set of devices. Admin users will have complete access to groups whereas, operator users will have only Read-Only access.
With dedicated support in OpManager, you can now monitor your Nutanix infrastructure through Prism API. To mention a few highlights:
OpManager now supports Slack integration. Avoid possible network downtime and see a measurable improvement in the average handling time for every network issue. Alerts from Slack can be configured in a notification profile or a step in an OpManager workflow task.
OpManager is now integrated with ServiceNow (provided as a default plugin). This integration allows you to log tickets on ServiceNow from OPM.
Other features include:
Users will now have their dashboard mapped to their profile. This unique dashboard can be customized based on the user's needs.
OpManager has now been upgraded to support Windows 2019 and Hyper-V 2019 devices.
Custom SNMP monitor creation has been added now. You can create/modify device templates to configure your own monitors for the SNMP-enabled devices in your network.
You can efficiently monitor and manage all your storage devices such as RAID and Tape Library with the help of storage monitor add-on. Its features include:
The number of device templates supported by OpManager over 11000 device types. They help with the initial configurations to classify the devices into pre-defined categories, and to associate monitors to them. You can modify existing templates or create your own as per your requirements.
How-tos and FAQs are added as quick links. These are positioned in-product to assist you in operating OpManager to its fullest.
To enhance your user experience, we have added a horizontal view. This user-focused design is specifically introduced to minimize navigation woes and enhance user experience.
AlarmsOne is now integrated with OpManager. AlarmsOne can be used to manage all your alarms in one console. It makes alert management simple with features like criteria-based alerting, noise reduction, on-call scheduling, escalations, etc.
This feature now allows you to generate a sharable embed link containing the NOC view. Click the regenerative private link button to generate a new link discarding the previously generated NOC.
OpManager now supports SMS gateway, allowing you to configure your own custom SMS gateway. After configuring the SMS gateway settings, create a notification profile to get alerted via SMS.
Inspect packets to know network response time (NRT) and application response time (ART) to find out what is causing the latency issue. Also identify top bandwidth consumers by source, destination, and conversations. This feature is available as an add-on.
OpManager now includes vendor templates to identify and classify devices based on their vendor type and category in order to avoid devices getting added as 'unknown'.
Now import devices templates in NCM module through an XML file.
Support for TrendMicro IWSVA 6.5, PaloAlto VPN logs, FortiGate management logs, SRX Management logs, and SonicWall_IpSec VPN logs has been included in the firewall log management module.
OpManager Standard/ Professional and Enterprise edtions include add-ons for managing bandwidth, configurations, firewall logs, IP addresses and switch ports. All these add-ons can be enabled by license and doesn't need any additional installation.
OpManager Standard/ Professional and Enterprise editions can now scale upto 1K and 5K devices respectively from a single server.
Automatically discover the newly added devices in the network with Scheduled Discovery. You can not only schedule, but create multiple profiles and choose the Discovery Rules that should apply to the devices and select the interfaces that you wish to discover.
OpManager now monitors Citrix Hypervisor via Hypervisor APIs for performance. Provides a map of the host-VM relationship.
Now discover VLANs from the Switch snapshot page and monitor all the interfaces in the VLAN for bandwidth and utilization.
You can now create performance dials for monitors that you wish and have them on the snapshot page. All you need to do is enable the "show dial" option for the corresponding monitor in device template.
Support for monitoring the performance of Exchange 2016 environment is newly added.
Leveraging Cisco UCS XML API, UCS Monitoring add-on helps you to monitor all the Cisco UCSes and its components, in your data center. The UCS monitor includes a 2D relationship map that helps you to visualize the relationship among the hosts, clusters, and VMs present in the UCS.
Some of the exciting enhancements that are newly added to network mapping are
OpManager can now be configured to detect event floods and anomalous event rates with predefined rules, and to perform remedial actions.
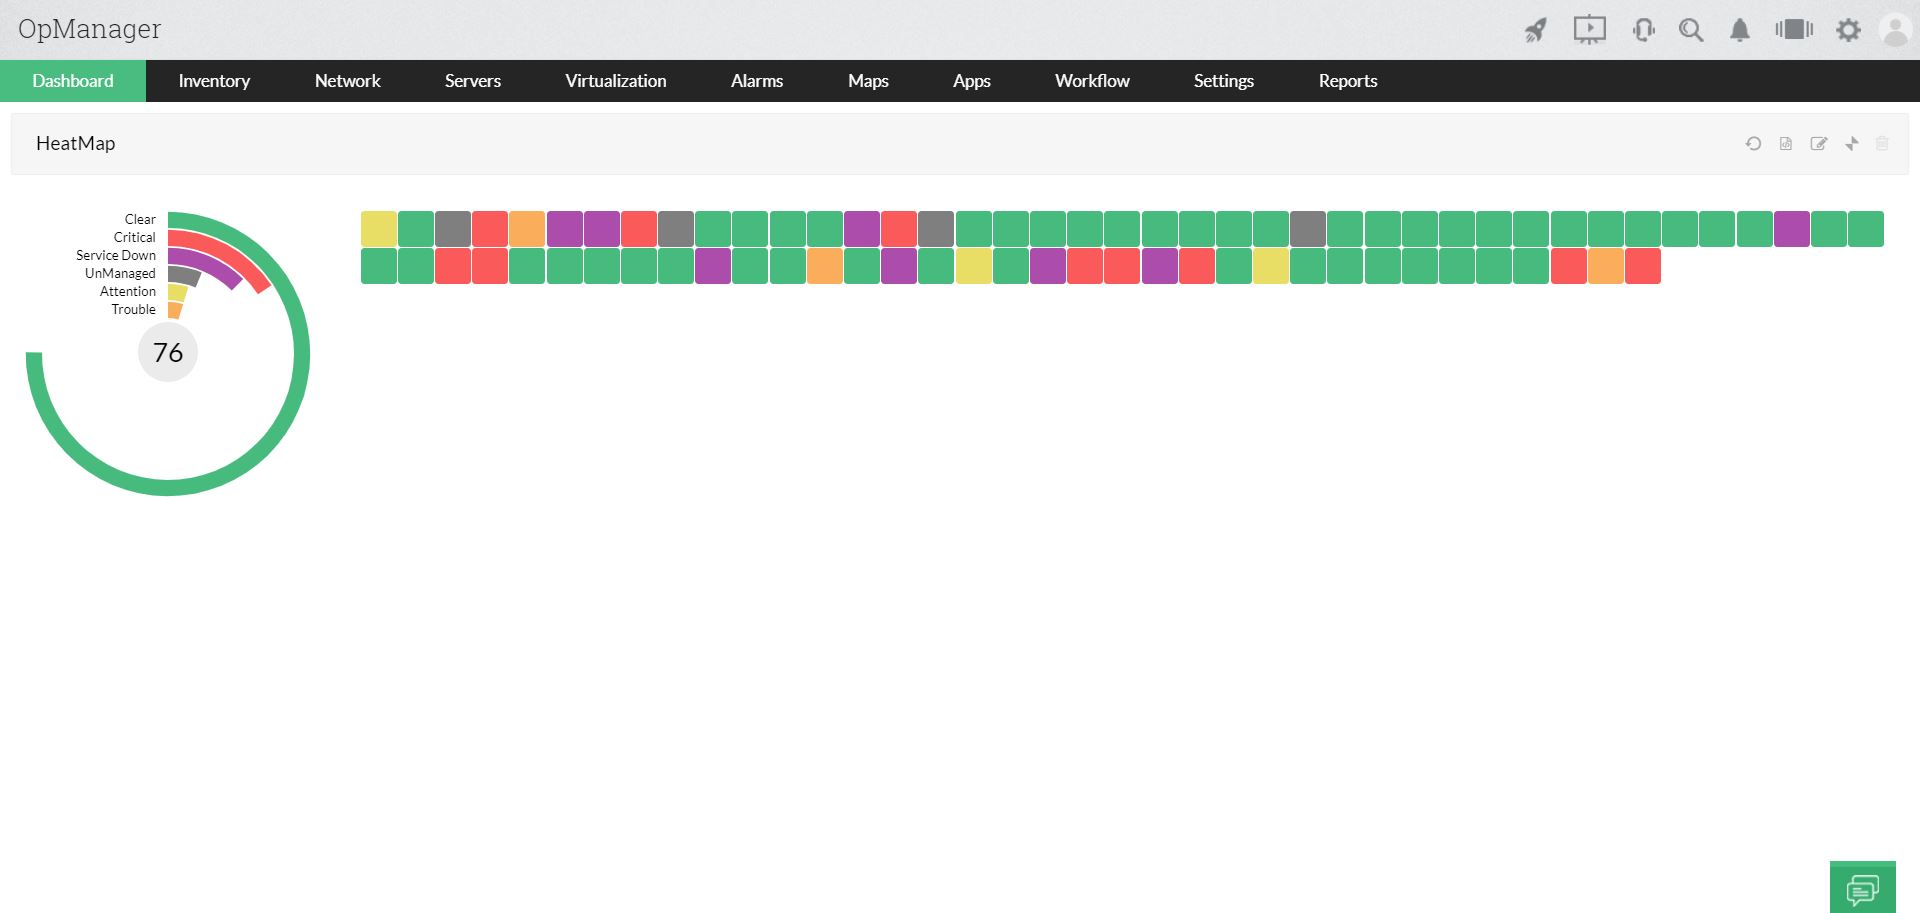
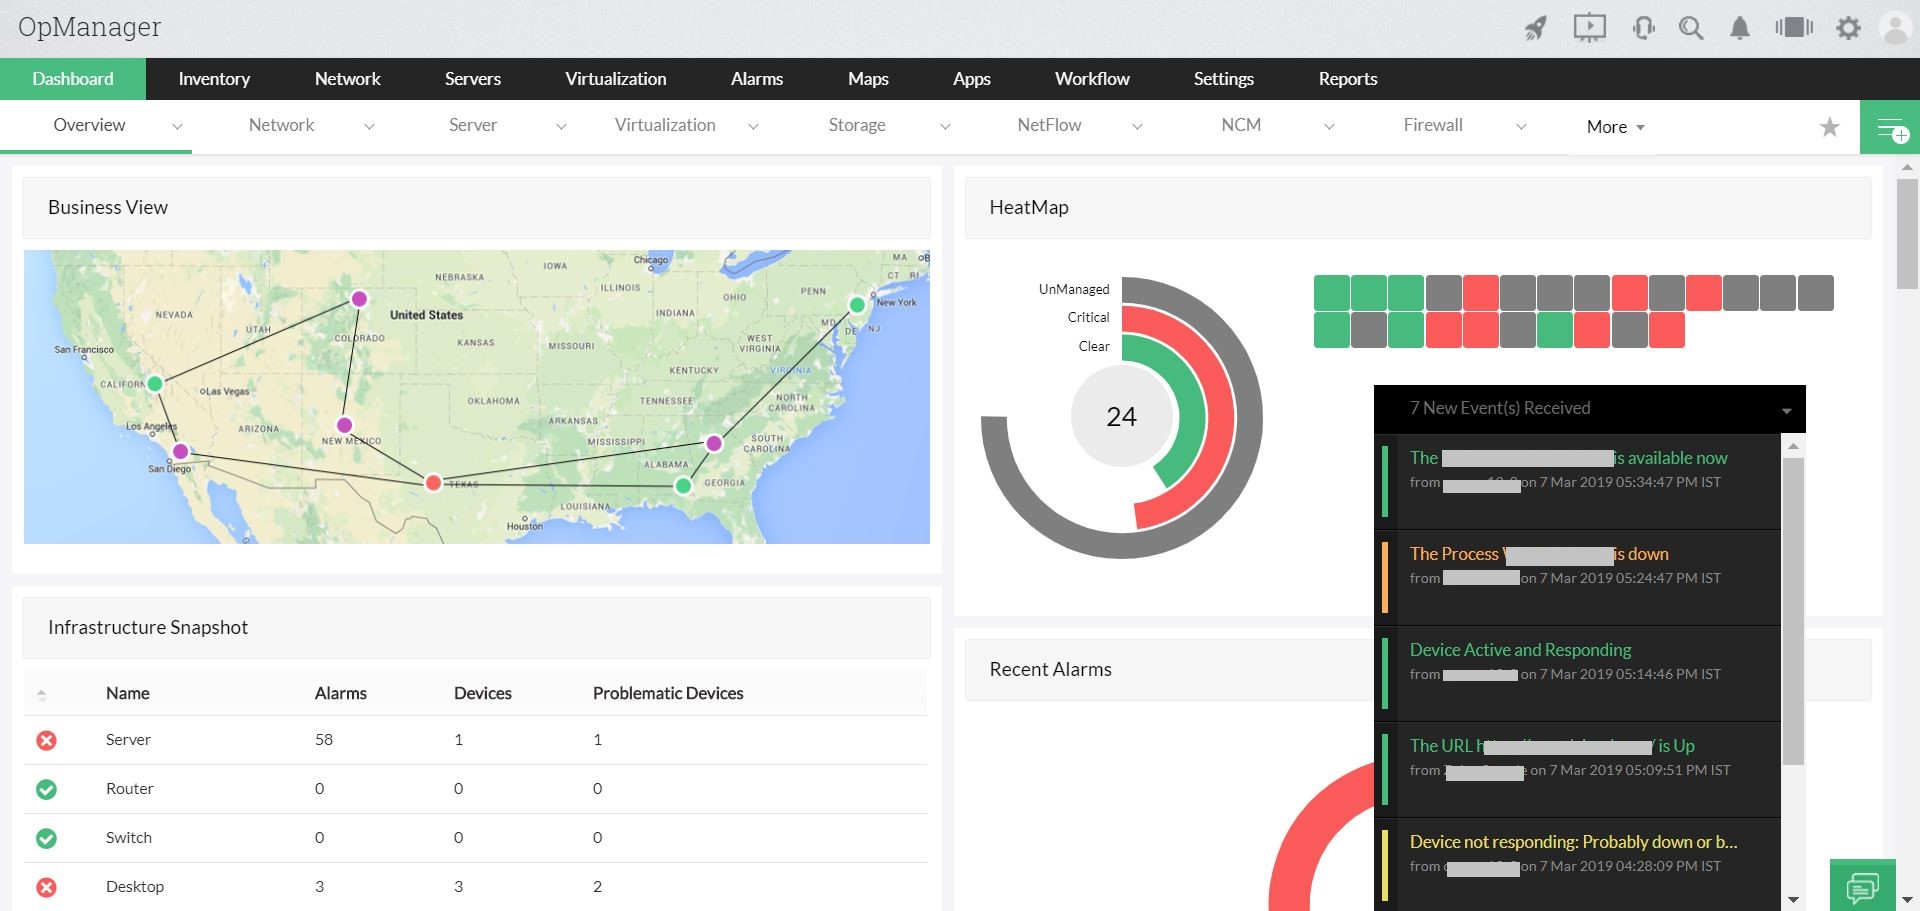
HeatMaps in OpManager helps to visualize your entire network health in real-time from a single page. It uses color codes to communicate the severity of the monitored devices. HeatMap view can be accessed from the inventory section.

Now with the help of popup notifications, you get to know what’s happening in your network in real-time. These notifications pops up at the bottom of the screen instantly alerting you about the alarms raised. This keeps you up-to-date on all the alerts generated in OpManager and limits the impact of failures on network performance.

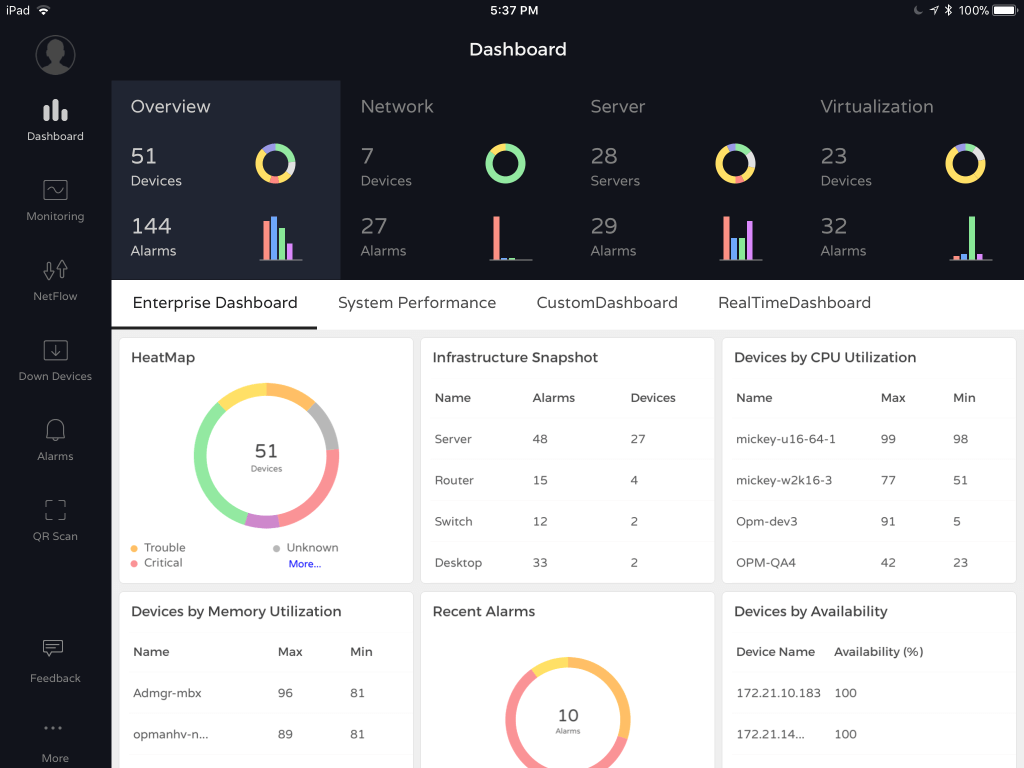
The new OpManager iPad app helps you to stay connected with your network on the move. It offers you a quick look at the availability and performance of your IT, customizable dashboards to suit your business needs and troubleshooting tools to resolve network glitches from anywhere. Learn More

Virtualization maps for VMware & Hyper-V provide a visual representation of relationships among hosts, clusters, and virtual machines. It helps you to gain quick visibility into your virtualized IT environment.

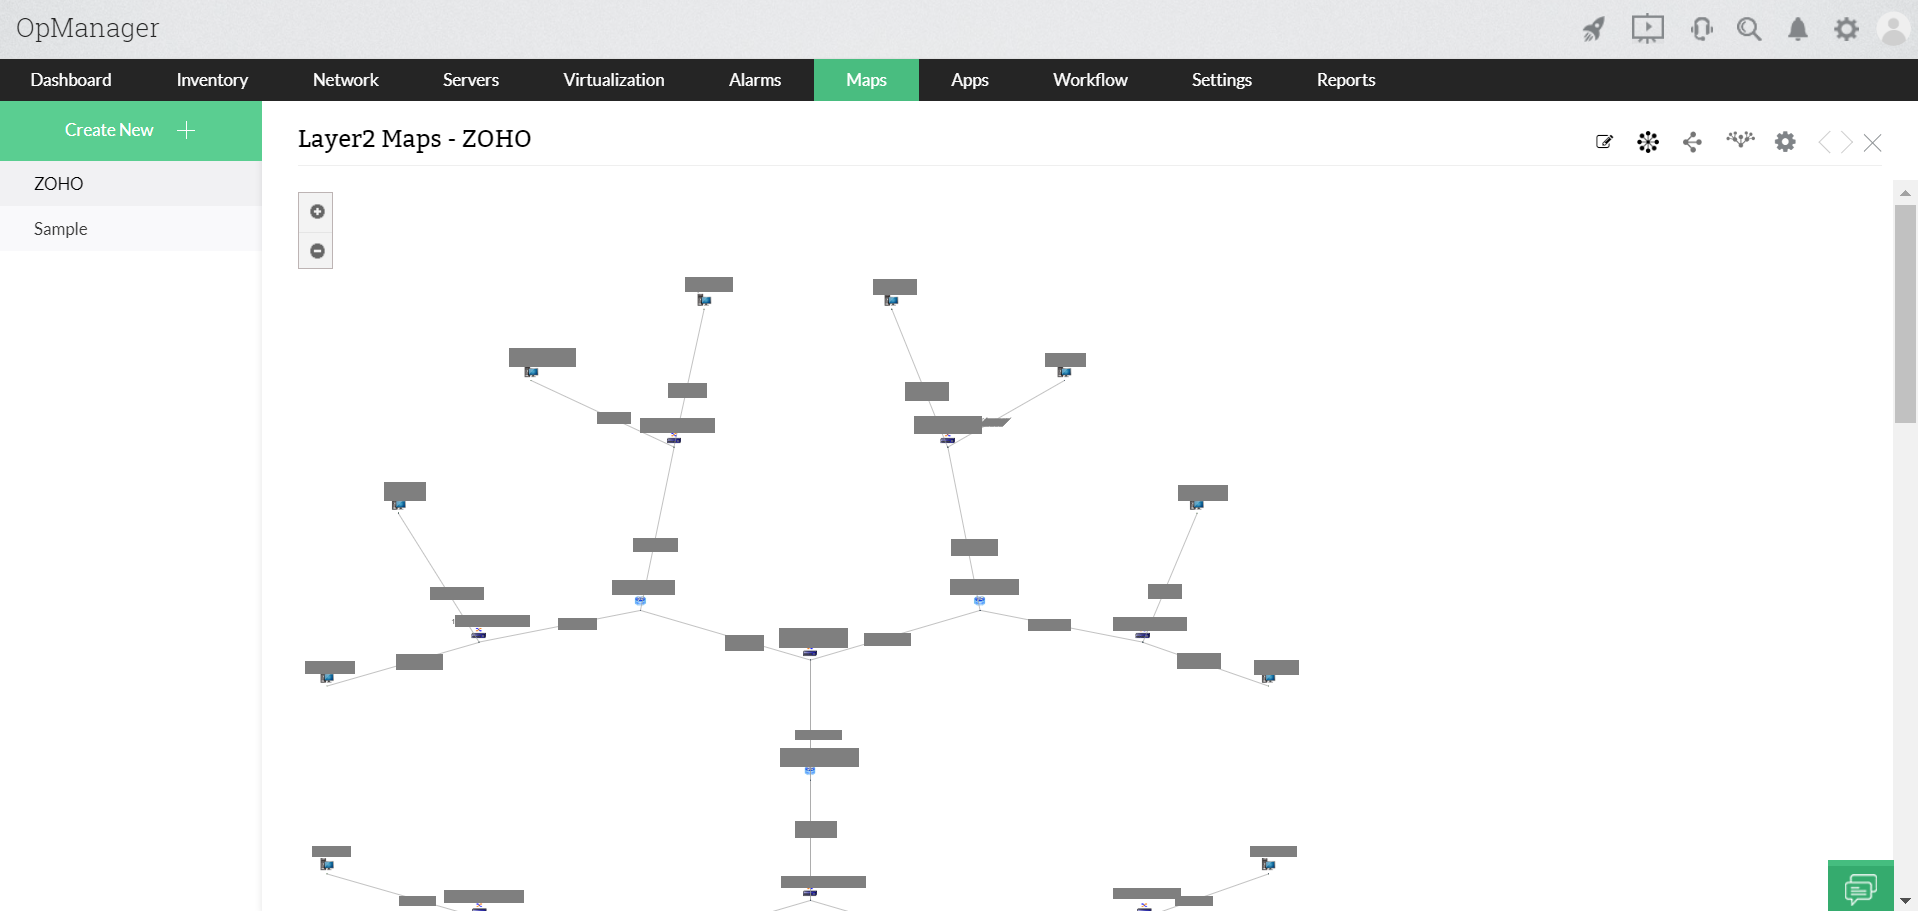
Enhanced Layer2 Network Mapping in OpManager now supports discovery of non cisco devices and end nodes (server, desktop). It also draws the Layer2 topology maps for the devices which are not discovered/ monitored in OpManager.
You can now switch between multiple languages from OpManager webclient. You can set the preferred language from Admin-> Personalize-> Language Selection.
With OpManager's 3D Data Center Builder, you can virtually create an exact replica of your racks and data centers. You can embed the views of your designs on your NOC screens and monitor them 24x7. The 3D data center can also be viewed from iPad and other tablets. This helps you to quickly access your data center from anywhere, anytime. [Watch Video]
OpManager by default supports about 11200 device templates that help in classifying the devices based on the vendor and model. Each device model has a unique device template that defines the list of monitors (metrics, eg: CPU Utilization) that will be associated to a device for monitoring performance.
OpManager now includes applications monitoring plug-in for in-depth monitoring of mission critical applications that include SAP, Websphere, Sharepoint, etc. This helps you gain visibility into application performance also. [Watch Video]
OpManager now supports monitoring hardware parameters such as voltage, power, fan speed, and status of processors of all the leading vendors. You can also generate reports on hardware health. [Watch Video]
You can now configure failover in OpManager Central (enterprise edition). This helps you achieve 24x7 monitoring of your distributed network.
OpManager leverages vSphere API for monitoring VMware host and VMs. This provides better understanding and control over your VMware infrastructure.
OpManager now supports monitoring IPv6 devices. The IPv6 devices can be added and monitored much like the IPv4 devices. [Watch Video]
Upgrade a standalone instance of OpManager to an enterprise Probe on-the-fly. This doesn't require you to start from the scratch and discover the network all over again! You can start from where you left! The OpManager Enterprise Edition can monitor 30,000+ devices.
Ensure high availability of OpManager by setting up hot-standby for Probes. You can now enjoy 24/7, uninterrupted network monitoring. The primary Probe fails over to a secondary probe and fails back as soon as the primary is up and the data across the redundant instances are always synchronized.
OpManager performs Class-less Inter-Domain Routing-based automatic discovery of network devices, services and applications, apart from Range and CSV file import options.
OpManager does an automatic Layer 2 and Layer 3 network discovery and mapping. The option to choose the "seed device" and the "network layout type" lets you come up with a neat representation of your network diagram, which can also be exported to Microsoft Visio. Further, the display of real-time health of devices and links empowers administrators with quick fault recognition and prevention.
OpManager comes with over 53k vendor templates enabling smart classification of the devices into Servers, Firewalls, Switches, Routers, Printers and Desktops, all grouped in different views. Also, try your hand at defining new templates and proudly share with other users!
Automate actions such as adding monitors, associating the devices to a business, etc. that you carry out after adding the devices to OpManager. This helps you monitor the devices as soon as they are added to OpManager without any delay, and also avoids the repetitive manual effort.
Create your own infrastructure views and the Business views for grouping systems and applications together intelligently for effective management (i.e. group by geography, business process, device type etc.). Business views-based reports are also available.
Now allow all the active directory users or the users in a specific group of an AD domain to gain access to OpManager web-client. The access privileges can be managed by the administrator. Alternatively, the administrator can also add an individual user and choose the 'AD authentication' user type for authenticating the user access through Active Directory. [Watch Video]
OpManager comes with comprehensive Performance Management functionality with a host of real-time graphs and historical reports for Availability, Utilization, Response times, Packet-loss and Inventory. You can monitor just about any resource on your network! Hereʼs a quick run-through of few categories and resources monitored:
OpManager leverages the industry–standard Cisco management technologies viz., NetFlow, IPSLA, NBAR etc., to monitor and manage all the network devices in the Cisco gamut. OpManager comes with over a 160 exclusive device templates for several variants of Cisco devices.
OpManager offers specialized views for routers and monitors the links for availability. It analyzes the traffic, utilization and error statistics. Help you analyze trends and plan your capacity with historical trends and reports. An intuitive user interface allows user to manage all infrastructure from a single console. Lets you add all the links to be monitored at one shot and also can drill down to see the root cause of poor WAN availability or performance using WAN RTT monitoring and NetFlow add-on
Ensure high quality of service in real-time for VoIP or Rich Multi-media traffic. Provides live visibility on performance and alerts immediately on outages and performance degradations. The dashboard is designed carefully to help you analyze the historical trends and troubleshoot during degradations.
Provides live view of Switches with out-of-the-box monitors for port utilization and critical resource parameters. OpManager allows you to configure thresholds to detect and prevent broadcast storms or any network irregularities.
Feel the pulse of your bandwidth with the new NetFlow monitoring add-on. Monitor, Analyze, Identify who or which application is causing the bandwidth spike and plan your bandwidth scientifically.
A separate category for Firewall is available under Infrastructure Views and the monitored resources include CPU, Memory, Active Connections etc. Integrating with Firewall Analyzer will help you to get insight on Security and Traffic related information. (Learn more)
Specialized views for monitoring wireless Access Points. Create templates for different wireless devices.
OpManager offers real-time visibility into the health of Servers in the network. Support out-of-the-box for IBM-AIX, HP-UX and Windows Vista too.
- Supports monitoring of HTTP, FTP, HTTPS, DNS, LDAP, NTP, MySQL, Oracle, MSSQL and more
- Monitors CPU, Memory and Disk Utilization
- Monitors key hardware parameters viz. Server Temperature for HP/ Compaq, Dell and IBM servers
- Provides out-of-the-box graphs and reports for server availability, response times and utilization
- Monitors Windows Services and Event Logs
- Monitor your Windows server performance in-depth with 25+ windows exclusive monitors
- Monitors Intranet or Internet URLs (HTTP or HTTPs site, supports monitoring of sites which require Authentication)
- Process Monitoring
- Supports Monitoring Applications like Oracle, Lotus Domino, RDBMS related monitors and offer specialized dashboards for Exchange, MS-SQL and Active Directory.
- Notifies when response time degradation occurs
OpManager now provides extensive Nutanix monitoring through Prism API. With Cluster, Host and VM Snapshot pages optimized for Nutanix devices, dedicated section under Reports and a brand-new dashboard (including Nutanix-specific widgets), you can make sure that you're always well informed of the status and performance of your Nutanix network.
OpManager’s VMware Monitor provides indepth, best-in-class VMware infrastructure monitoring and troubleshooting through over 70 deep VMware metrics; leverages VMware API. The agentless monitoring of VMware-virtualized servers gives IT administrators a single fault and performance management console for entire server infrastructure - both physical and virtual.
Monitor Microsoft Hyper-V servers for availability and performance. OpManager monitors Hyper-Vs using WMI and provides over 50 performance monitors out-of-the-box for Hyper-V hosts and VMs. An exclusive Hyper-V dashboard with details such as VMs, Datastores, Storage Adapters, Monitors, etc, you can quickly identify and address performance bottlenecks or optimize VM resources. Hyper-V hosts are automatically discovered as virtual servers during the initial network discovery.
Monitor log files of mission critical applications such as MSSQL, Oracle, etc. in real-time. The agent constantly monitors the log files for the print of a string that may even be a regex. Once that particular string is printed in the log, OpManager raises alarm. At present OpManager monitors log files printed in English only.
Consolidate and manage your network monitoring scripts in OpManager management console. OpManager executes custom scripts and parses the output to trigger meaningful alarms. Set threshold and get alerted during abnormal situations by leveraging OpManager’s fault management functionality.
OpManager offers a separate view for UPS in your network and monitors the UPS load, its status, battery status, etc.
Monitors printer availability and alerts automatically for Paper Jam, No Paper, Low Paper, No Toner, Low Toner and so on.
OpManager out-of-the-box supports monitoring NetApp devices for availability and performance. It also offers extensive reports. [Watch Video]
Navigate across the modules and integrated ManageEngine applications with OpManager's new, enhanced GUI. The intuitive tabs to easily access the required network performance data, improved page-loading speed, and quick links to information on how to go about doing some tasks with option to submit instant feedback, provide a smooth user experience.
Network Change, Configuration and Compliance Management in OpManager is achieved using the NCM add-on. Manage your network devices easily. Take regular configuration back-up, rollback to good know configuration in a single click, troubleshoot irregularities, audit changes, enhance security and comply with regulations from a single console. The latest version [Watch Video] of the add-on allows you to
Perform several bulk configuration and management tasks using the Quick Configuration Wizard, like associating notification profiles, alarm suppression, bulk-deletion, bulk association of monitors etc.
Configuration templates are available out-of-the-box for devices, interfaces, process monitoring, scripts monitoring, files & folders monitoring. Effect changes at the individual devices level or at the templates level to apply it to multiple devices/interfaces.
Now configure multiple thresholds namely Warning, Trouble, and Error for the performance monitors. This helps you break the fault into three stages and take corrective actions accordingly.
Automate your repeated IT actions using OpManager Workflows. The routine tasks that need execution either during network faults or as an on-going maintenance task, can be automated using this new module. Help document.
Performs intelligent event processing. It filters and correlates network events and presents only meaningful alarms to the Operator.
OpManager listens for SNMP traps from devices and processes them into meaninful OpManager alerts. All critical trap-types are supported out-of-the-box and it lets you define custom processors. OpManager provides you an option of loading the Traps from various MIBs dynamically from the Web Client.
OpManager can be configured to automatically notify users through email or SMS, whenever an alarm occurs. In-fact for Routers and Switches, you can select the interfaces for which you wish to be notified.
Get instantaneous information about current performance usage with Real Time Graphs. Available for any performance monitors (eg. CPU, Memory, Disk & etc.), Interface Traffic and Bandwidth Utilization
Access your OpManager anytime from anywhere using the new SmartPhone GUI. You need now wait to get to the root of the problem even if you are miles away.. The OpManager SmartPhone GUI lets you drill down the alert and perform the first level troubleshooting from wherever you are.
Even after tedious network performance audits, devices do fail. It is essential to know these network anomalies and act on it immediately. OpManagerʼs Syslog daemon helps you to know these irregularities within split seconds and empower your visibility into your network.
OpManager’s Windows Event Log Monitoring provides several automatic rules to monitor critical security logs across all windows servers and workstations in your network. You can easily detect events such as failed logons, logon failures due to bad passwords, account lockouts, failed attempts to access secure files, security log tampering etc.
Support Web alarm functionality to facilitate NOC staffs. NOC team will be clued-up onscreen immediately during network performance degradation or outage.
Write your own self-healing scripts and configure OpManager to trigger the script automatically to recover from a service or device failure.
If you are also using ManageEngine ServiceDesk Plus, you can Integrate OpManager and Configure to log a trouble ticket to a particular technician, Set category and priority dynamically. It is possible to log a ticket for every device type and parameters monitored.
OpManager provides a huge collection of critical troubleshooting tools to perform the first and second levels of troubleshooting viz. Switch Port Mapper, Real Time Graphs, Trace Route, Ping, Remote Desktop Top, Weblinks, MIB Browser & etc. More here.
Special add-on features are built into the Premium edition for monitoring
Perform operations like adding a device, associating a profile to devices etc using REST APIs. Using these APIs, you can create scripts to interact with OpManager or integrate OpManager with 3rd party IT management/service desk software.
OpManager supports MSSQL database in addition to bundled pgSQL. Provision to migrate existing pgSQL data to MSSQL is configurable. Utilities to facilitate the data backup and restore are bundled as part of the application.
OpManager provides exhaustive performance reporting with over 100 in-built reporting profiles out-of-the-box. All the reports are intuitively grouped by category and view besides exclusive dashboards for specialized servers like AD, Exchange, Virtual Servers etc. The reports can be exported and saved as a PDF/XLS file as well as printed or emailed.
Various options for further customization are provided to create tailor-made reports from the in-built reports e.g. selecting of "Top N reports", changing the reporting period, changing the reporting business snapshot to consider another grouping of devices for the selected reporting profile etc..Complementing the daily, weekly and monthly performance reports is the option to schedule the reports. What's more! The reports can be automatically emailed to configured email Ids.
Connect to OpManager server and view the performance of all the devices, recent alarms, and business views from your iPhone. Download the App now.