ManageEngine recognized in the 2023 Gartner® Magic Quadrant™ for Application Performance Monitoring and Observability. Read the report
✕OpenShift is a powerful and flexible open source container application orchestrated and managed by Kubernetes. These containers are complex to set up, monitor, and maintain; to outmaneuver the operational challenges faced when dealing with OpenShift containers, round-the-clock OpenShift monitoring is necessary. With Applications Manager's OpenShift monitoring tool, you can simplify application maintenance and ensure that OpenShift performance is up to par.
Automatically discover the entire layout of your OpenShift deployments. Applications Manager's OpenShift monitoring capability enables you to monitor OpenShift metrics of all the containers present in your OpenShift environments, and presents a consolidated view of the clusters and nodes in your system.
Applications Manager's Openshift performance monitoring tool provides extensive stats on various key performance indicators. With this information, you can manage your containers to guarantee your deployed applications are always running optimally.
Gain visibility into operational data, such as the number of resources used and the cluster and pod usage details with Applications Manager's OpenShift cluster monitoring software. Allocate and manage your resources better by tracking the capacity and resource utilization of your cluster, and drill into specific parts of the cluster.
Allocate and manage resources efficiently with details about resource usage by nodes like CPU, disk, pod, and memory with Applications Manager's Openshift application monitoring tool.

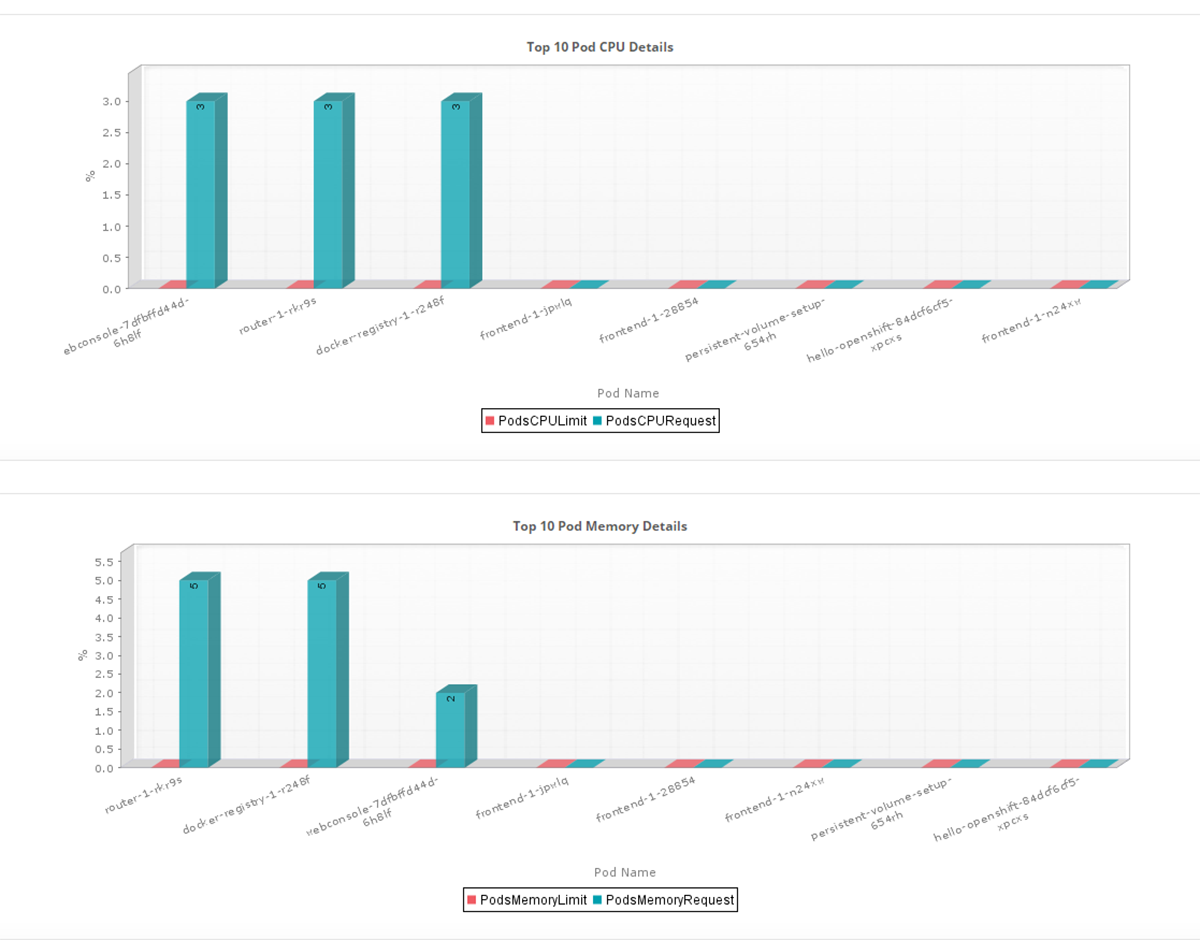
With Applications Manager's Openshift monitoring software, get details about the pods in a cluster, such as Pod Type, Pod IP, Pod Status, Pod Start Time, and Pod Created Time. Track spikes in resource consumption, and know how often requests fail for all containers on a specific node with the help of resource consumption stats.

Gain insight into containers, and understand the various services and deployments inside OpenShift with Applications Manager's OpenShift pod monitoring solution. Services are assigned an IP address and port pair that, when accessed, proxy to an appropriate backing pod. With the information provided, it's easy to track the number of network requests sent across clusters within a distributed service from locations all around the world.

See how Applications Manager fulfills your OpenShift application monitoring needs. Schedule a personalised demo now!
Request DemoReplica controllers and replica sets are created to guarantee the availability of a specified number of identical Pods. OpenShift performance metrics like the number of Desired Replicas, Running Replicas, and Available Replicas is presented in the OpenShift monitoring dashboard for quick reference.
A job tracks the overall progress of a task and updates its status with information about active, succeeded, and failed pods. With Application Manager's OpenShift application monitoring software, track the Parallelism Replicas, Desired Replicas, Successful Replicas, and other such key OpenShift monitoring metrics to deduce the status of jobs and the time taken to complete them.

Applications Manager's OpenShift management software comes with an extensive fault management system to make resolving issues easy. With help from the root cause analyzer, you can drill down to the source of problems and troubleshoot them with ease.
You can configure threshold values for attributes and receive notifications when there are deviations from standard behavior. Applications Manager's OpenShift application monitoring capability enables you to associate automated actions—such as e-mail, SMS, REST API actions and more— to the attributes to be performed upon breach.
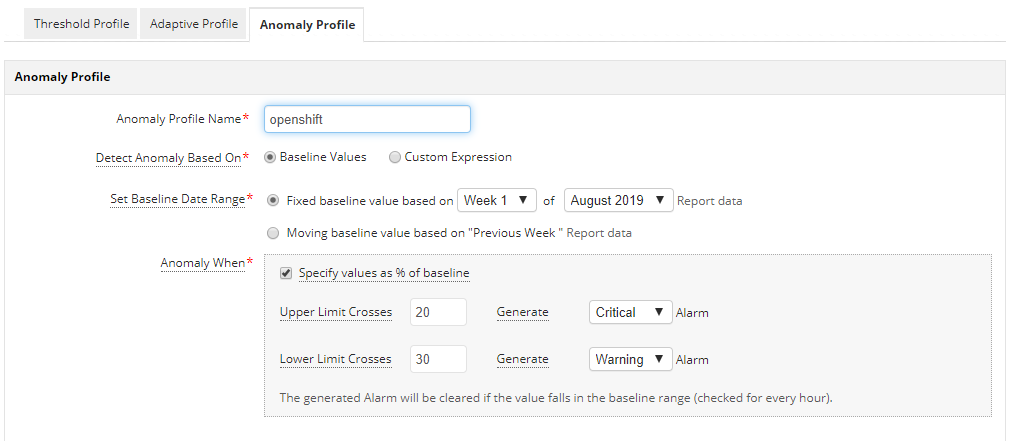
Set up anomaly profiles with baseline limits to various attributes to identify gradual performance degradation, so you can take action before end users are affected. Applications Manager's OpenShift monitoring helps establish the baseline values as a percentage of a fixed baseline value or opt for 'Dynamic baselining' where the data will be compared with the previous week.

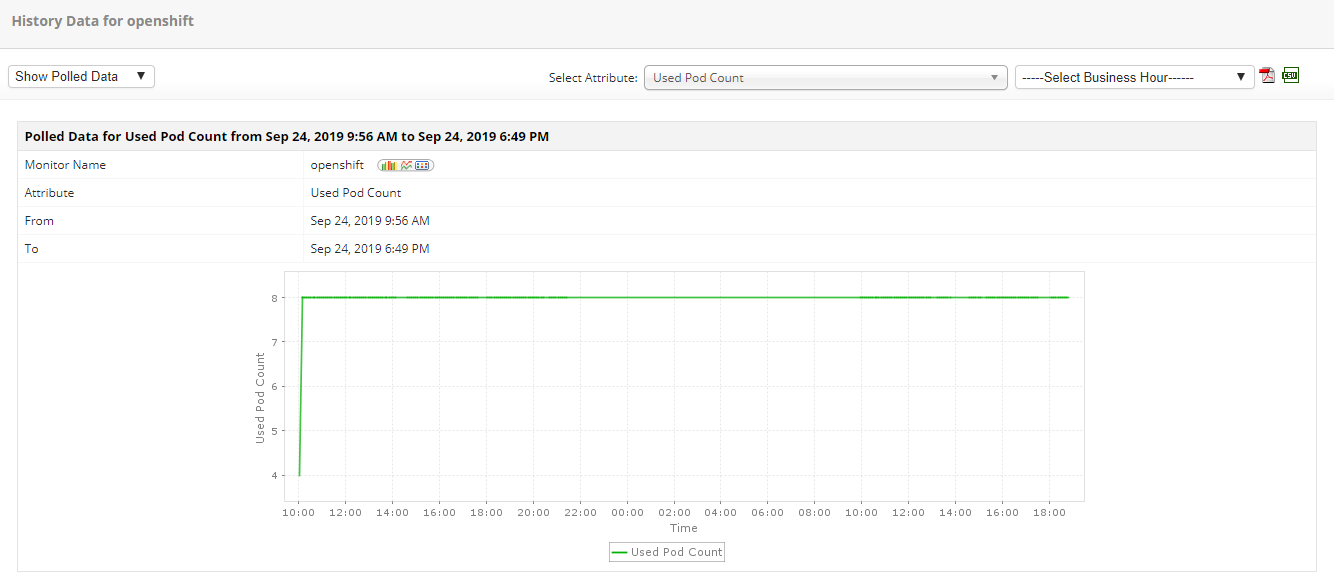
Don't stop with just monitoring Openshift containers, plan out your utilization and analyze your performace. Perceptive OpenShift monitoring tools like Applications Manager's reports utilize analytical details to perform historical and predictive analysis of OpenShift performance. While trend analysis reports allow you to compare and analyze historical performance trends based on hourly/daily/weekly reports and heat charts, forecast reports employ machine learning techniques to predict growth and utilization trends in the future. At a Glance reports are convenient for quick peeks as it gives away a great deal of information, even at a glimpse.

Experience the features of OpenShift monitoring on your own by downloading Applications Manager's full-fledged, 30-day free trial!
In addition to OpenShift container monitoring, Applications Manager serves as an excellent container monitoring solution with Kubernetes monitoring and Docker monitoring capabilities.

It allows us to track crucial metrics such as response times, resource utilization, error rates, and transaction performance. The real-time monitoring alerts promptly notify us of any issues or anomalies, enabling us to take immediate action.
Reviewer Role: Research and Development


