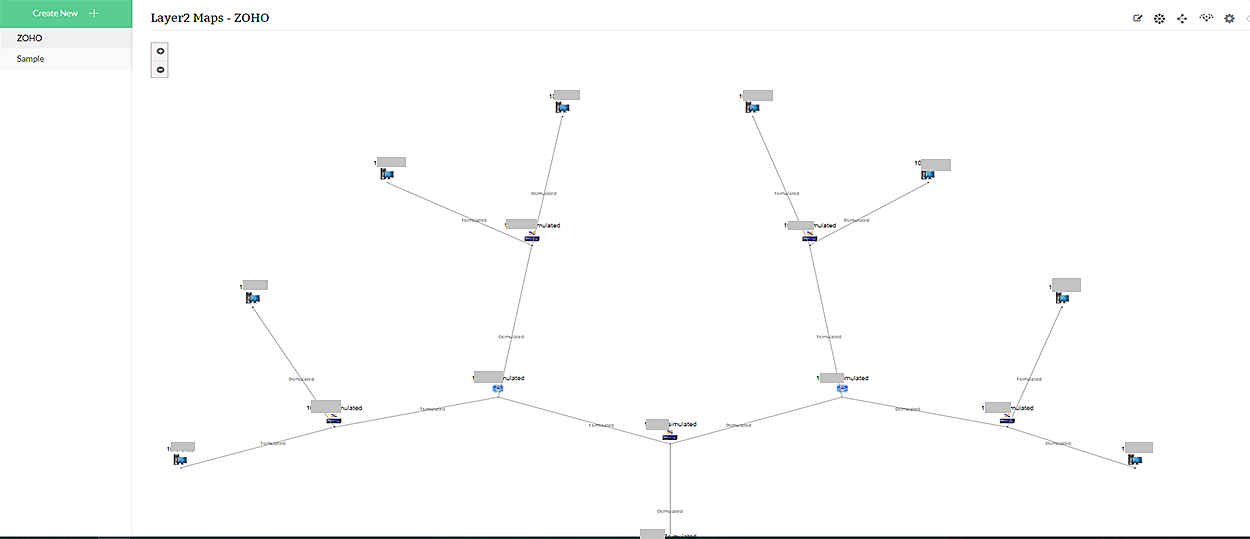
Network visualization: Layer 2 maps
OpManager is a network visualization solution that allows you to discover and visualize Layer 2 devices connected to your network. In addition to interfaces, this offers a comprehensive map of all nodes, interlinked layers, and port-to-port connection.
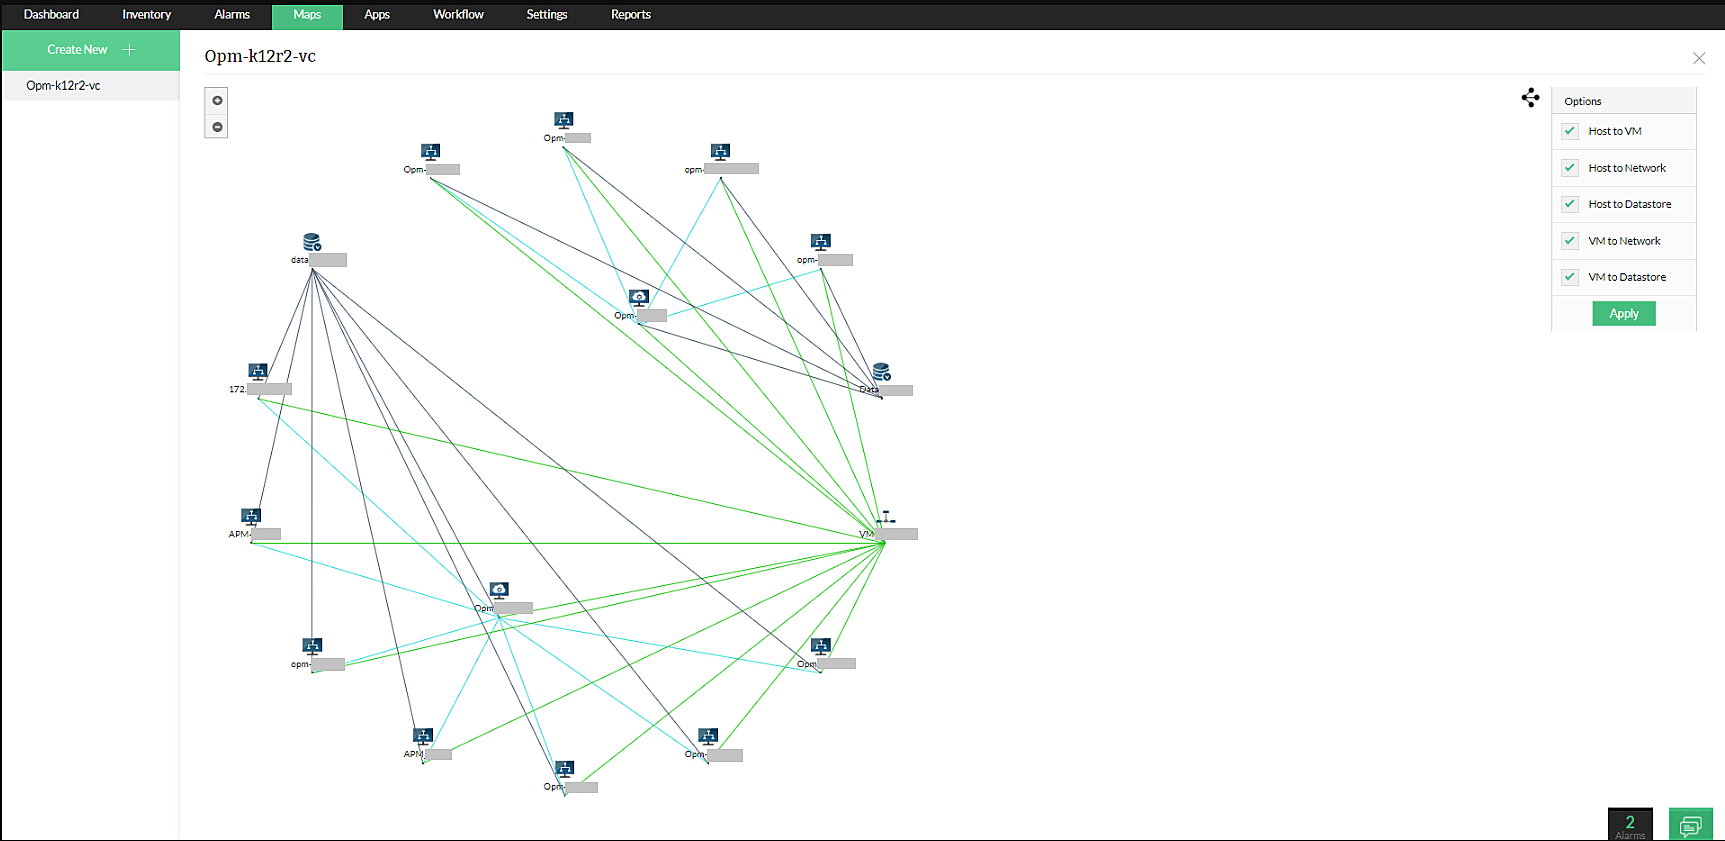
Network visualization: Virtual machine topography maps
OpManager visualizes your virtual networks. The virtual network topology maps in OpManager depict the relationship between hosts, virtual machines, and data stores. You may also track VM migration across physical hosts with OpManager's network topology visualization tool.
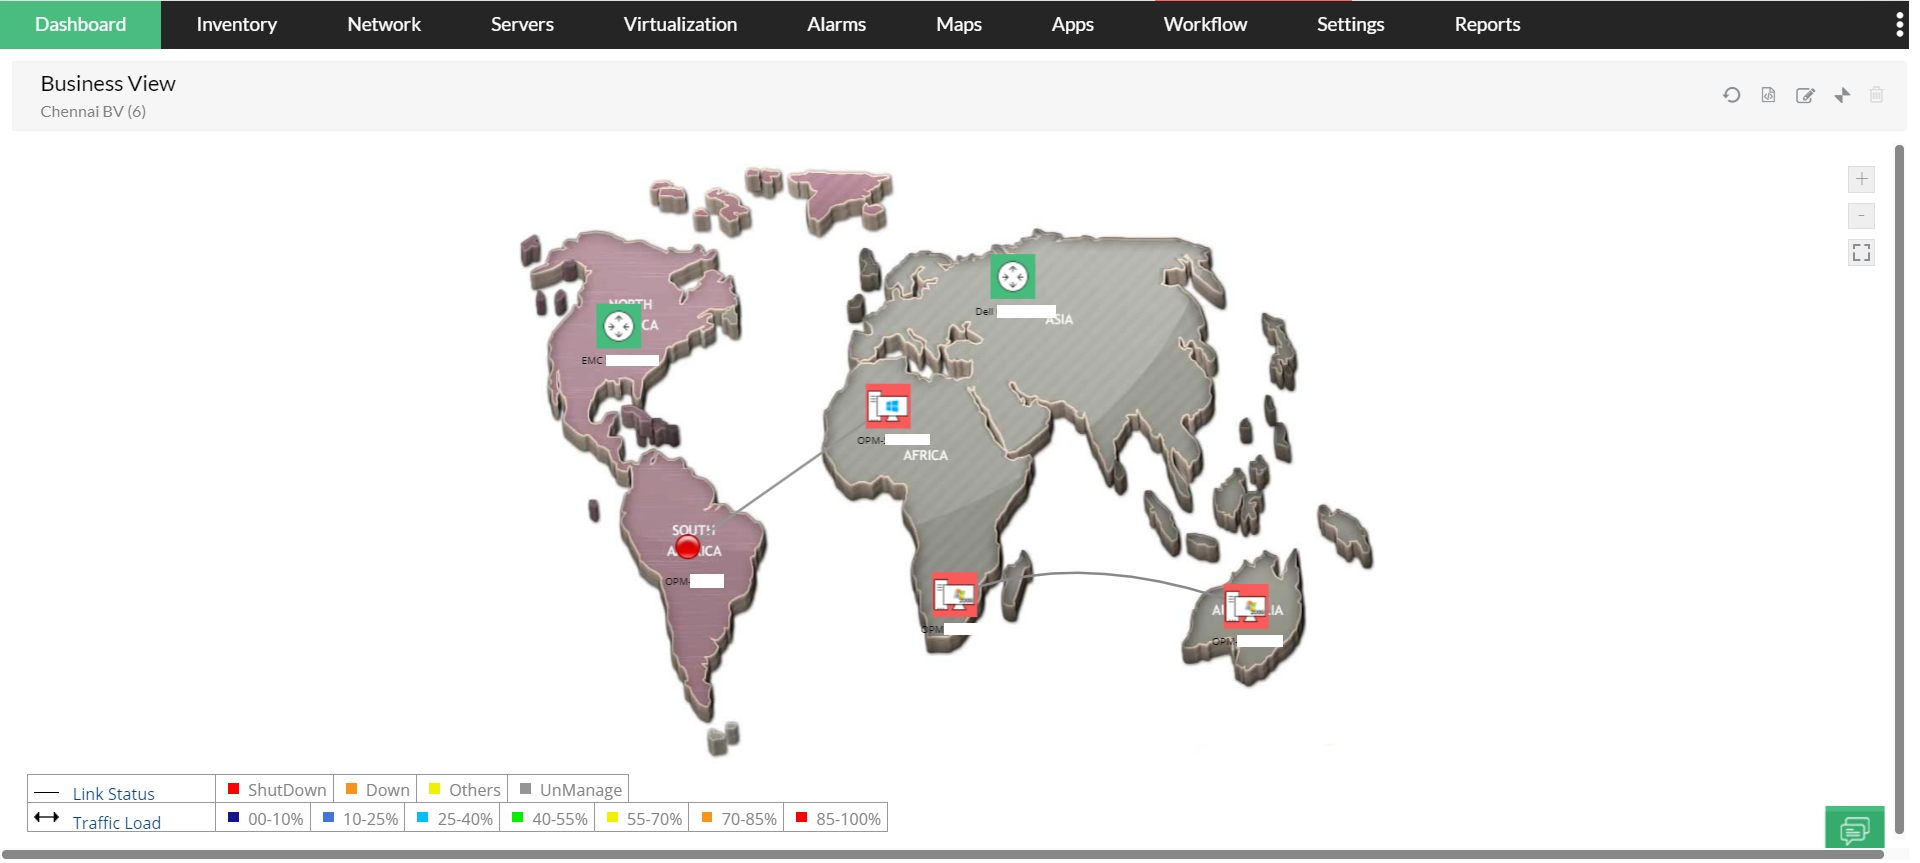
Network visualization: Business views
OpManager, the best network visualization software, uses a drag-and-drop diagram builder to create business views. In OpManager, business views show devices in a graphical format based on the business service they deliver. This ensures the continuous availability of mission-critical programs and facilitates network troubleshooting.
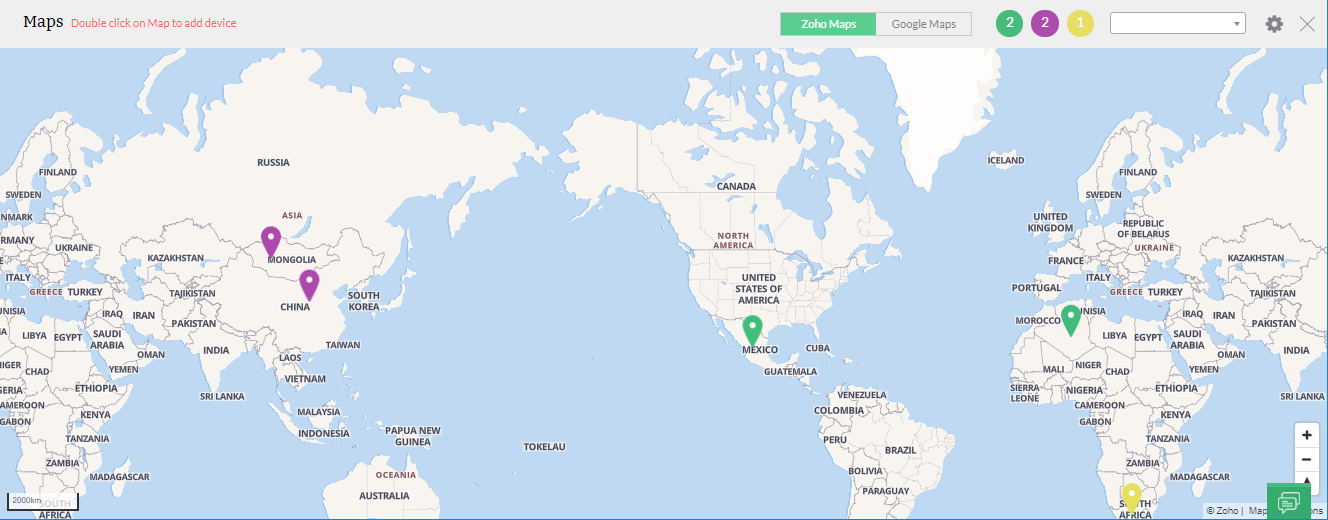
Network visualization: Zoho Maps and Google Maps
The default map source for the maps feature in OpManager is Zoho Maps. It can be used to visualize your network by arranging devices on maps based on their geographic distribution. The same ground distance in miles or kilometers can also be displayed using Zoho Maps. With OpManager's network visualization, you can also Google Maps and place devices on it based on their geographic distribution.
Network visualization on Hyper-converged infrastructure (HCI)
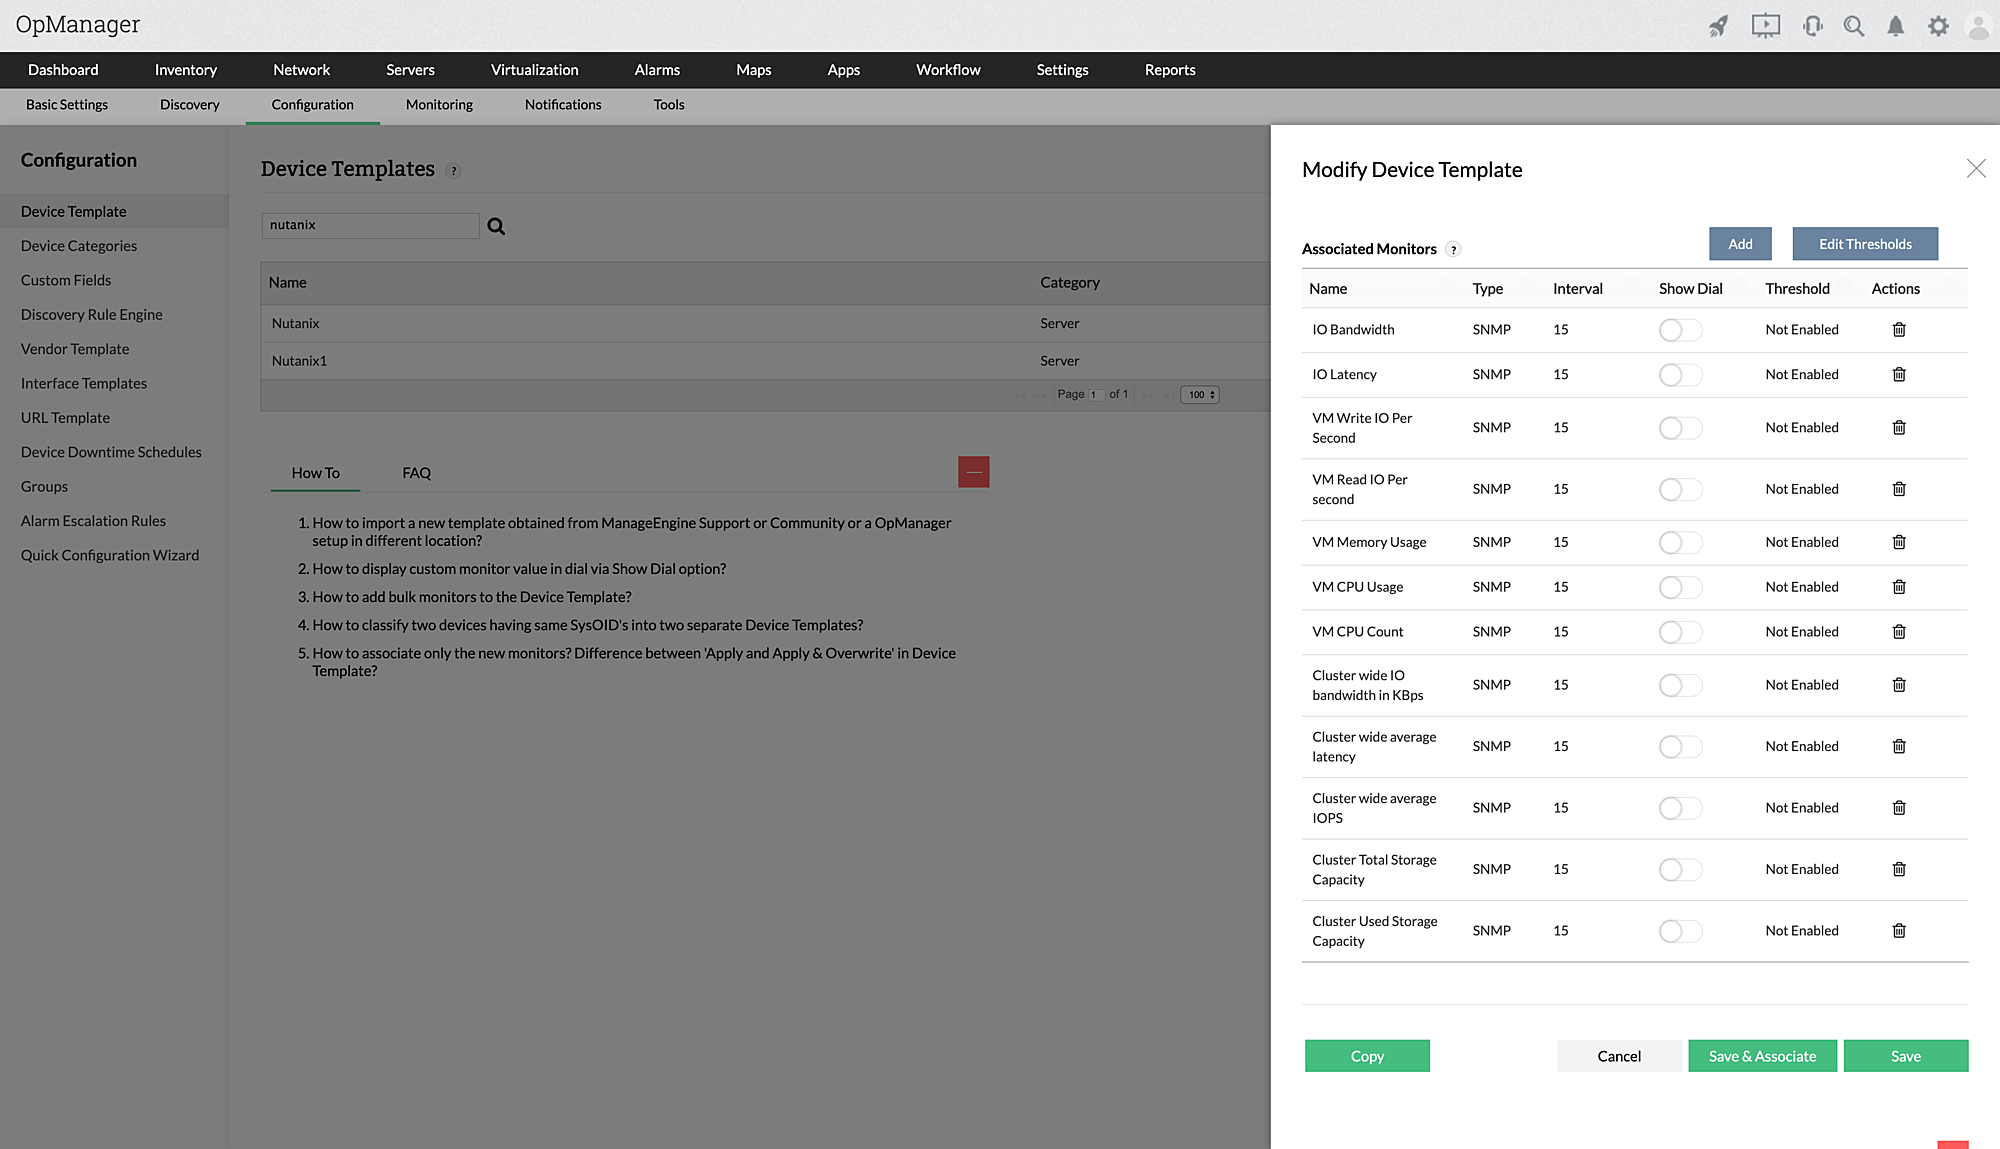
Hyper-convergence is an IT framework that combines storage, computation, virtualization, and networking into a single system to simplify data center management and boost scalability. OpManager's network visualization software enables you to discover the Nutanix cluster, which will automatically discover hosts and VMs, and display their relationship by placing them on a map. You can add the Nutanix Prism Central to automatically discover all the clusters mapped under the HCI device. This will give you a detailed network map of each and every virtual machine in the organization managed by the HCI, irrespective of the number of nodes.
Network visualization on Software-defined networking (SDN) infrastructure
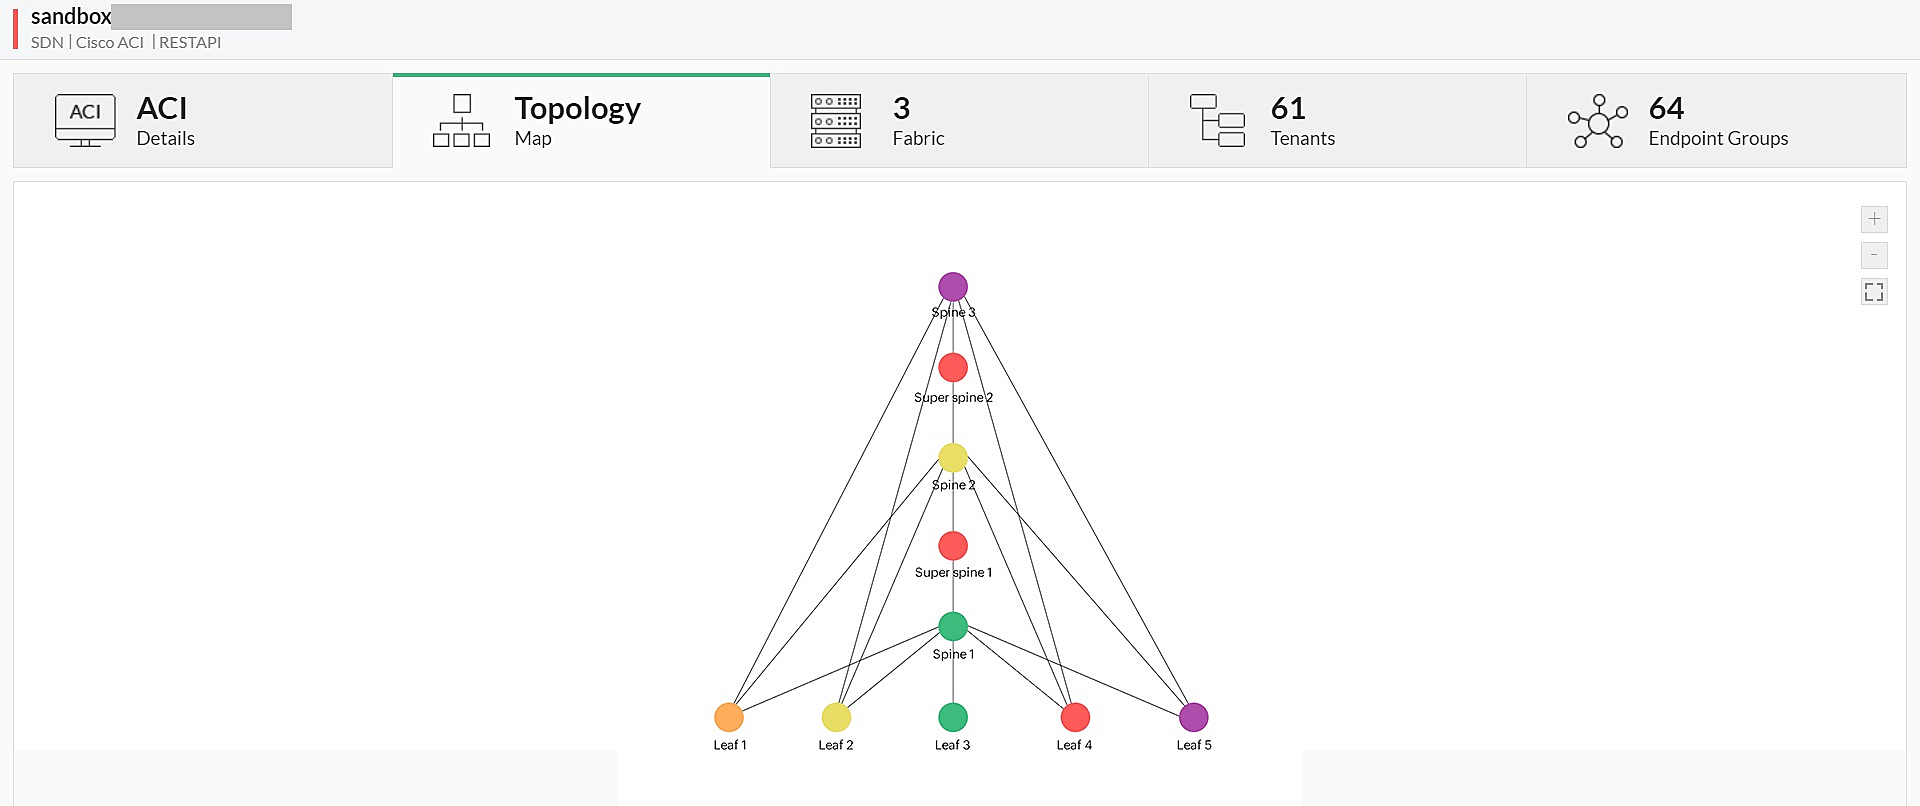
SDN is a network architecture approach that allows networks to be intelligently and centrally controlled using software applications. Regardless of the underlying network technology, this allows operators to manage the entire network consistently and holistically. Application Centric Infrastructure (ACI) is Cisco's SDN architecture for data centers. OpManager's network visualization automatically plots the topology map of your ACI environment for better visualization. This gives you a comprehensive look at the APIC controller, the spines, and the leaves available in your network and how they are interconnected. Click on a device and you’ll see its availability status too. The Topology tab is pretty much a network map with live status updates.
Network visualization: Software-defined networking wide area network (SD-WAN) topology view
A SD-WAN is a virtual WAN that allows businesses to securely connect users to applications using a combination of transport services architecture, such as Multiprotocol Label Switching (MPLS), Long-Term Evolution (LTE), and broadband internet services.
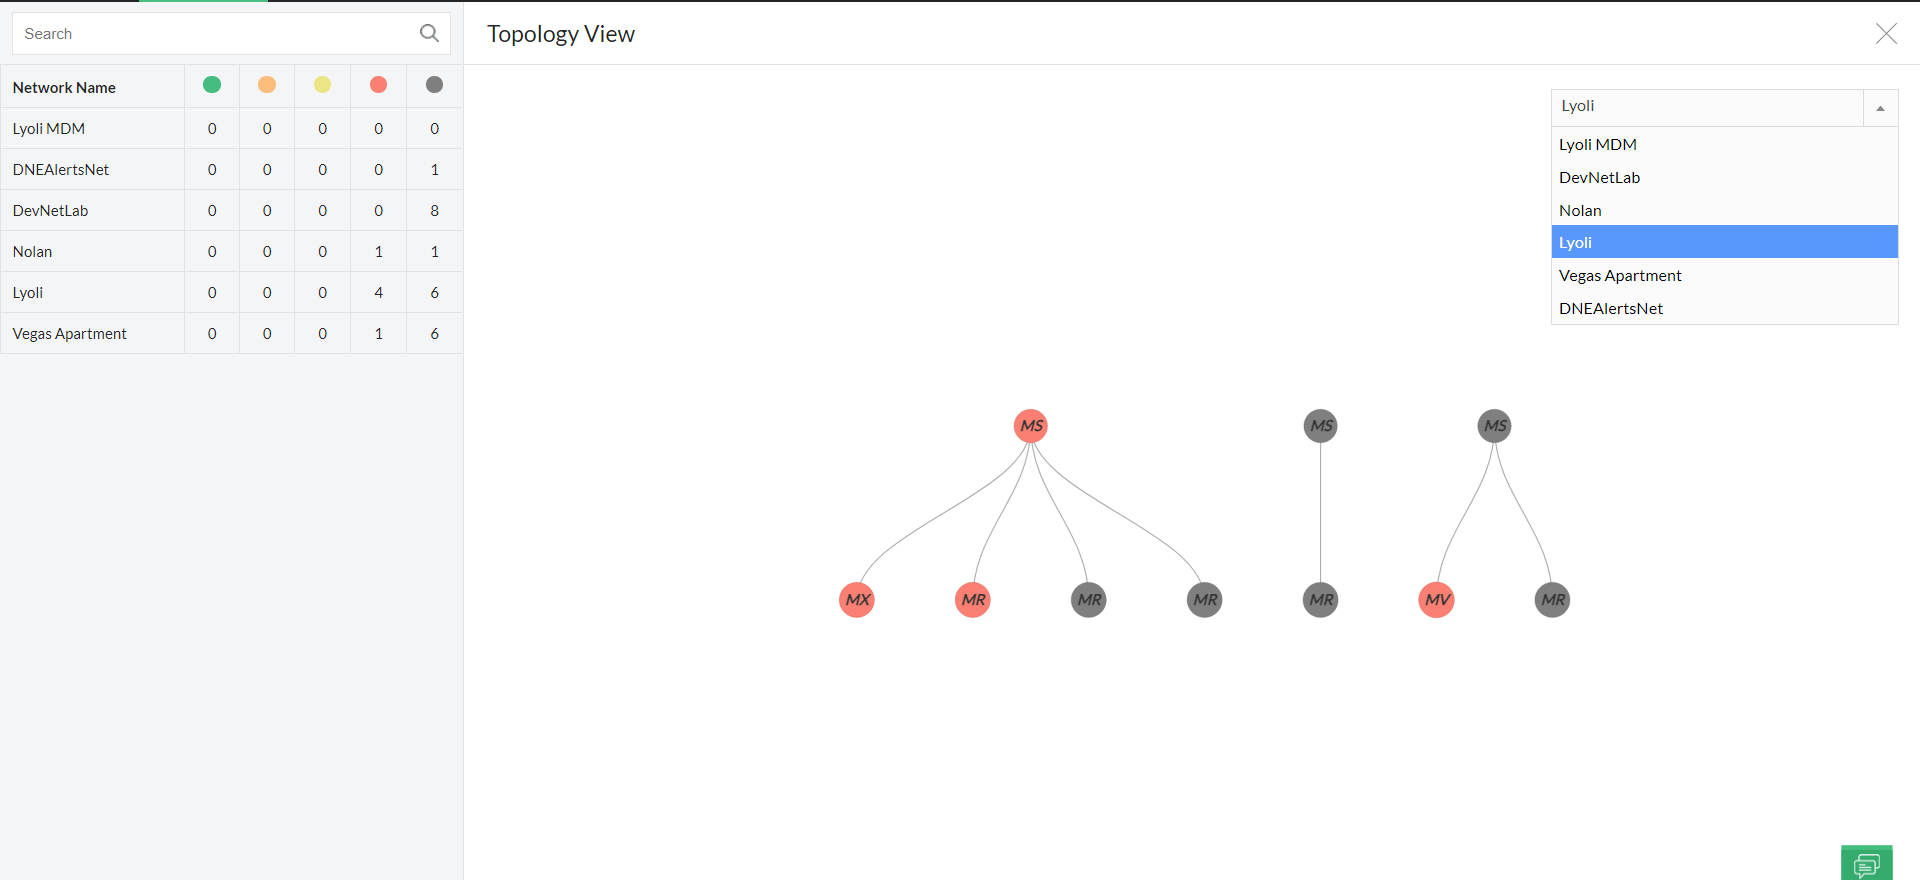
OpManager's network visualizer's topology view option gives you a complete map-like representation of the various devices in each network of the discovered Cisco Meraki controller, which has built-in SD-WAN technology. This topology view option helps you know the interconnections between the various devices in the selected network.
Network visualization: 3D rack and floor views
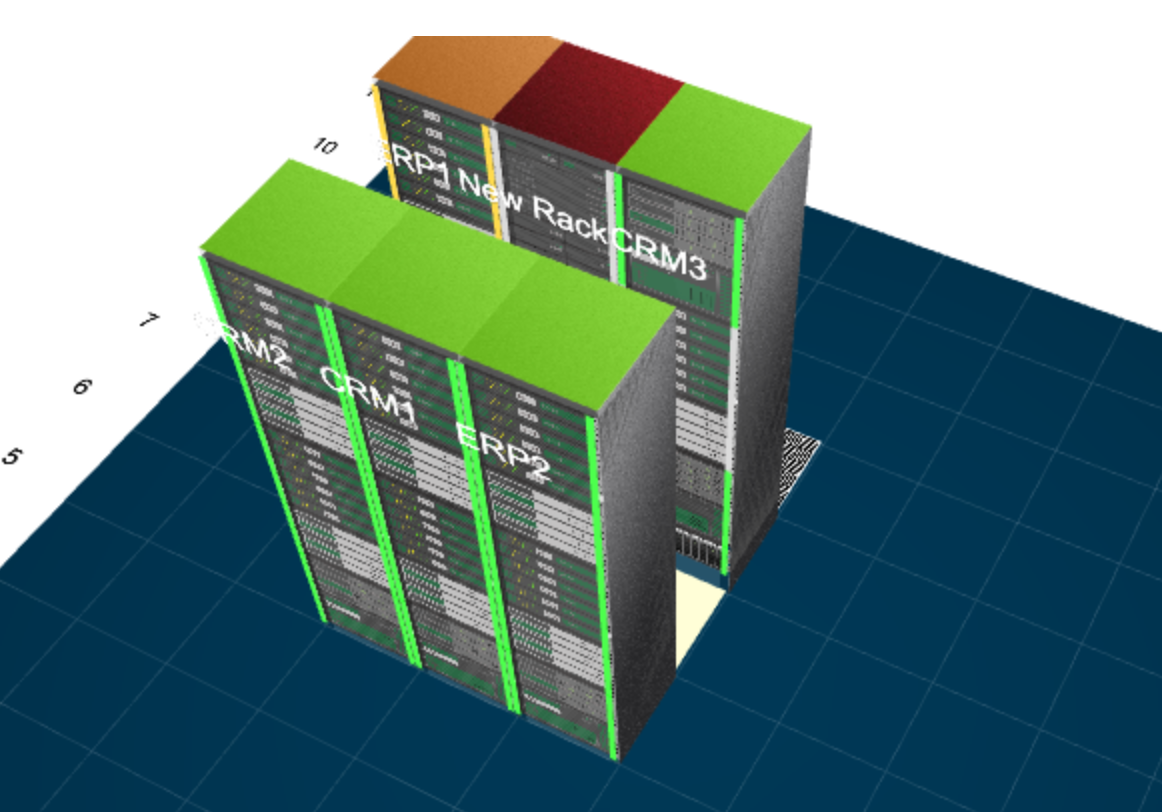
OpManager's network visualization software allows you to make virtual three-dimensional replicas of your data centers. You can build 3D rack and floor views of your server rooms with OpManager. These views assist network administrators in keeping track of server availability and status.


