Network uptime monitoring: Devices
Continuously monitors your entire network for its uptime and network availability. OpManager's network uptime monitor sends a ping to the monitored devices every two minutes. If there is no response after two consecutive pings, then OpManager will consider the device unavailable. The number of pings and their time interval can be assigned depending on business need.
OpManager polls the device for availability using ICMP Ping. The ping serves as an effective tool to detect the availability of devices for an IT admin.
For non-ICMP environment, especially to monitor uptime for your edge router or DMZ zone devices, you can use Telnet instead. The default availability polling interval is five minutes and you can customize it to a specific device group or for a particular device, based on your need.
Network uptime monitoring: Interfaces
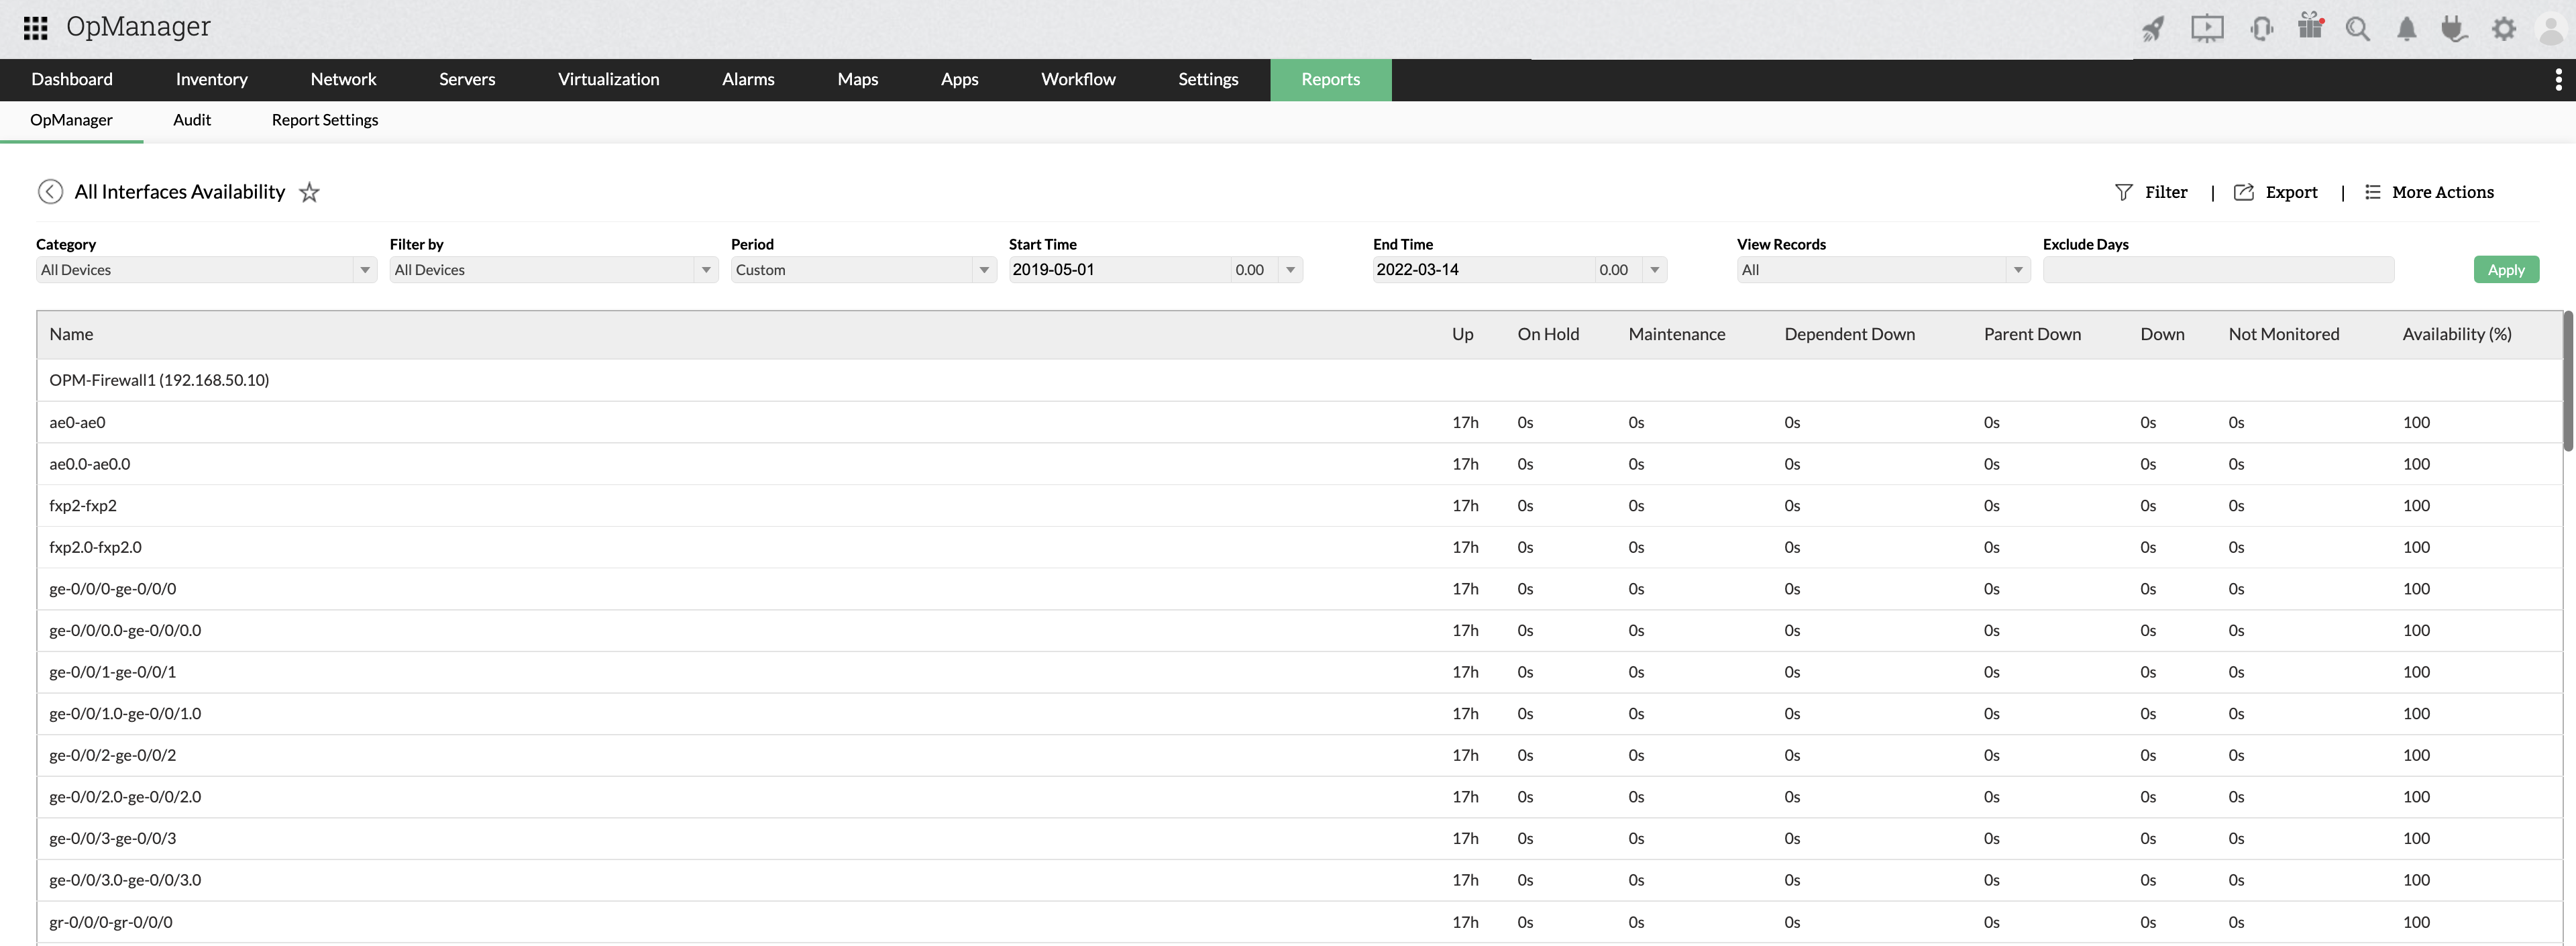
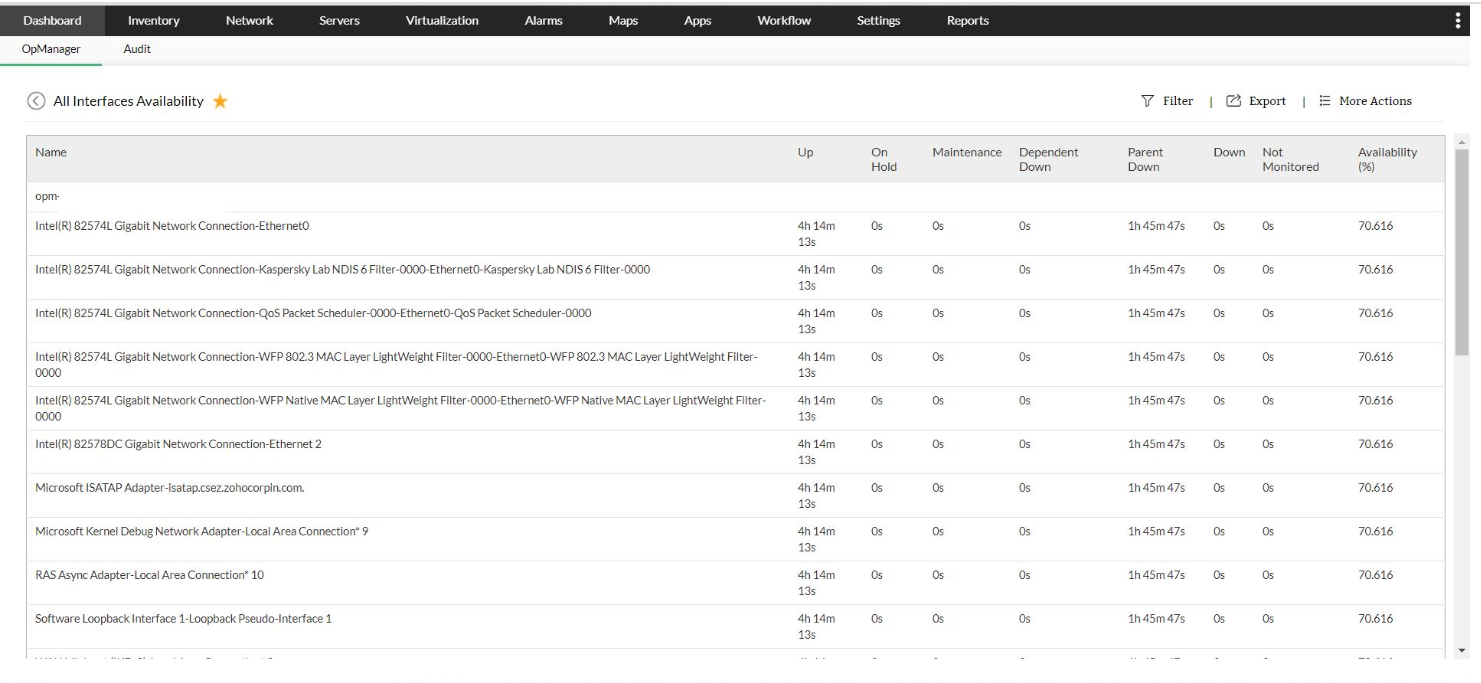
OpManager's network uptime monitor provides an SNMP-based monitoring to check interface uptime and port availability for each element in the enterprise network and IT infrastructure. It provides uptime report showing interface availability on a daily, weekly, monthly, or custom period to measure your network level availability and ensure that your SLAs are being met. These interface or port statuses are propagated across multi facets through individual device status, Layer 2 network maps, business view or custom device groups, and network weather maps.
Network uptime monitoring: Servers
Servers are the core elements of any IT infrastructure. It is vital that they always be accessible, to ensure the smooth running of internal processes and the availability of your services. Server uptime, or the amount of time your servers are available to users, is one of the most important factors for optimizing network performance.
OpManager's server uptime monitoring feature provides you with detailed graphs and reports about availability and response time of Transmission Control Protocol (TCP) services that are monitored. The service monitoring functionality in OpManager is customizable and you can choose the intended service for monitoring.

Network uptime monitoring: Windows services
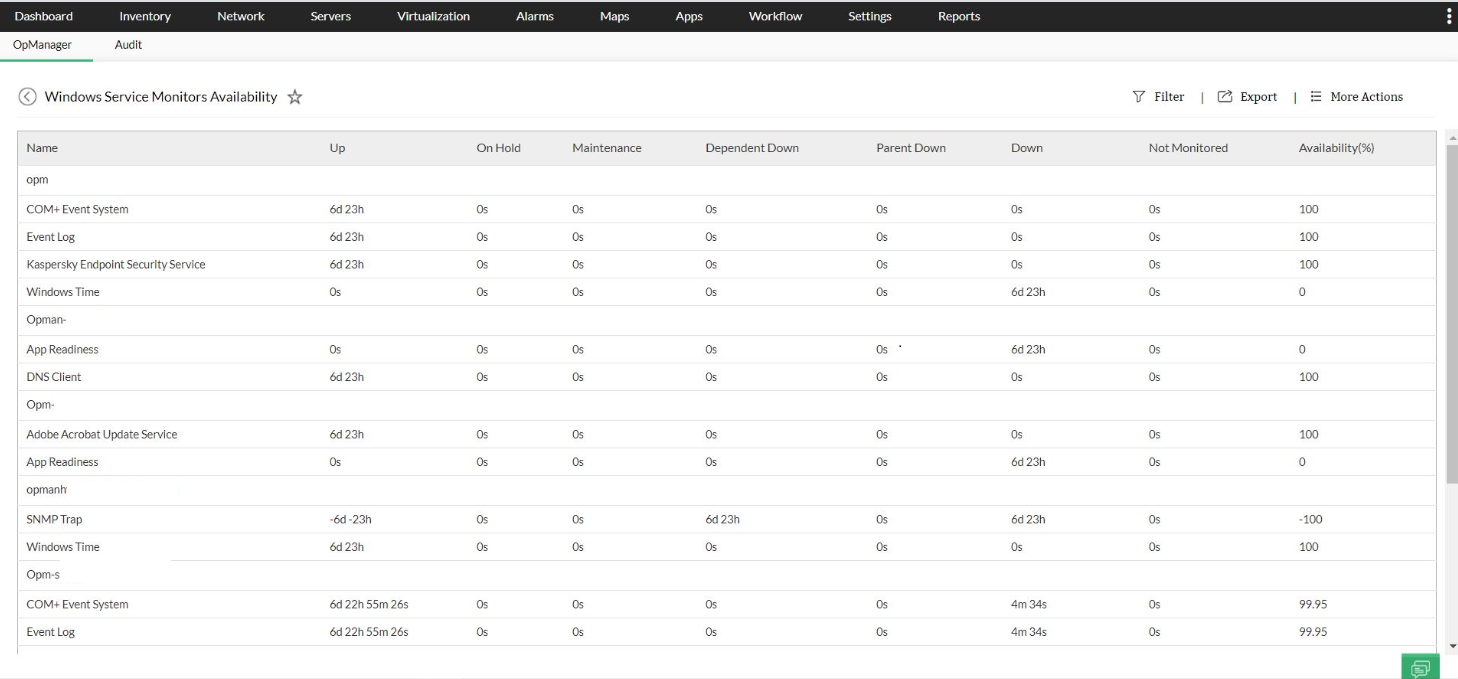
OpManager offers windows network uptime monitoring by supporting monitoring of system level services like Windows services using Windows Management Instrumentation (WMI). Similar to the system level services monitoring, you can discover any Windows services and monitor them using OpManager. Further the administrators can configure OpManager to automatically restart the service or the server when the Windows service is found to be down from the operations console. Learn More >>
Network uptime monitoring: Websites
ManageEngine OpManager's network uptime monitor performs the crucial task of monitoring your website for availability around the clock, 365 days per year. It monitors HTTP/ HTTPS URLs, intranet sites, web server farms, web applications with a login, Windows NT LAN Manager (NTLM) authenticated websites, and many more. Apart from URL uptime monitoring, you can also check for a particular content in your website. Website availability monitoring ensures the website is not under the attack by hackers.
Network uptime monitoring: Processes
OpManager's process uptime monitoring enables administrators to remotely monitor and manage processes that are running on servers. OpManager uses a variety of protocols, such as SNMP, WMI, and CLI, to monitor the processes running on Windows, Linux, Solaris, UNIX, HP UX, IBM AIX, ESX and VMware servers and virtual machines, etc.
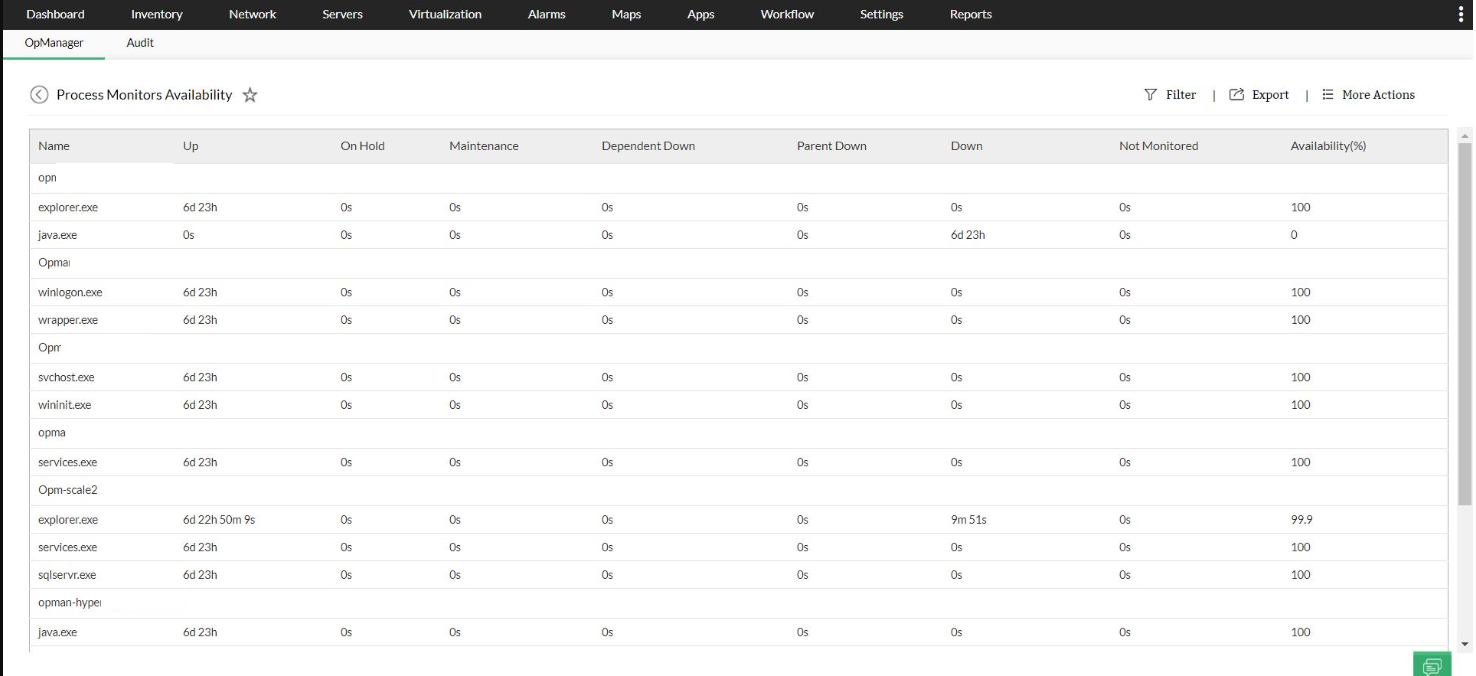
Learn more about OpManager's Process Availability Monitoring.
How is the uptime of a device calculated?
Let's consider a device monitored for a week and calculate its uptime.
Number of seconds the device was down: 3600 seconds.
Number of seconds the device was monitored: 6,04,800 seconds
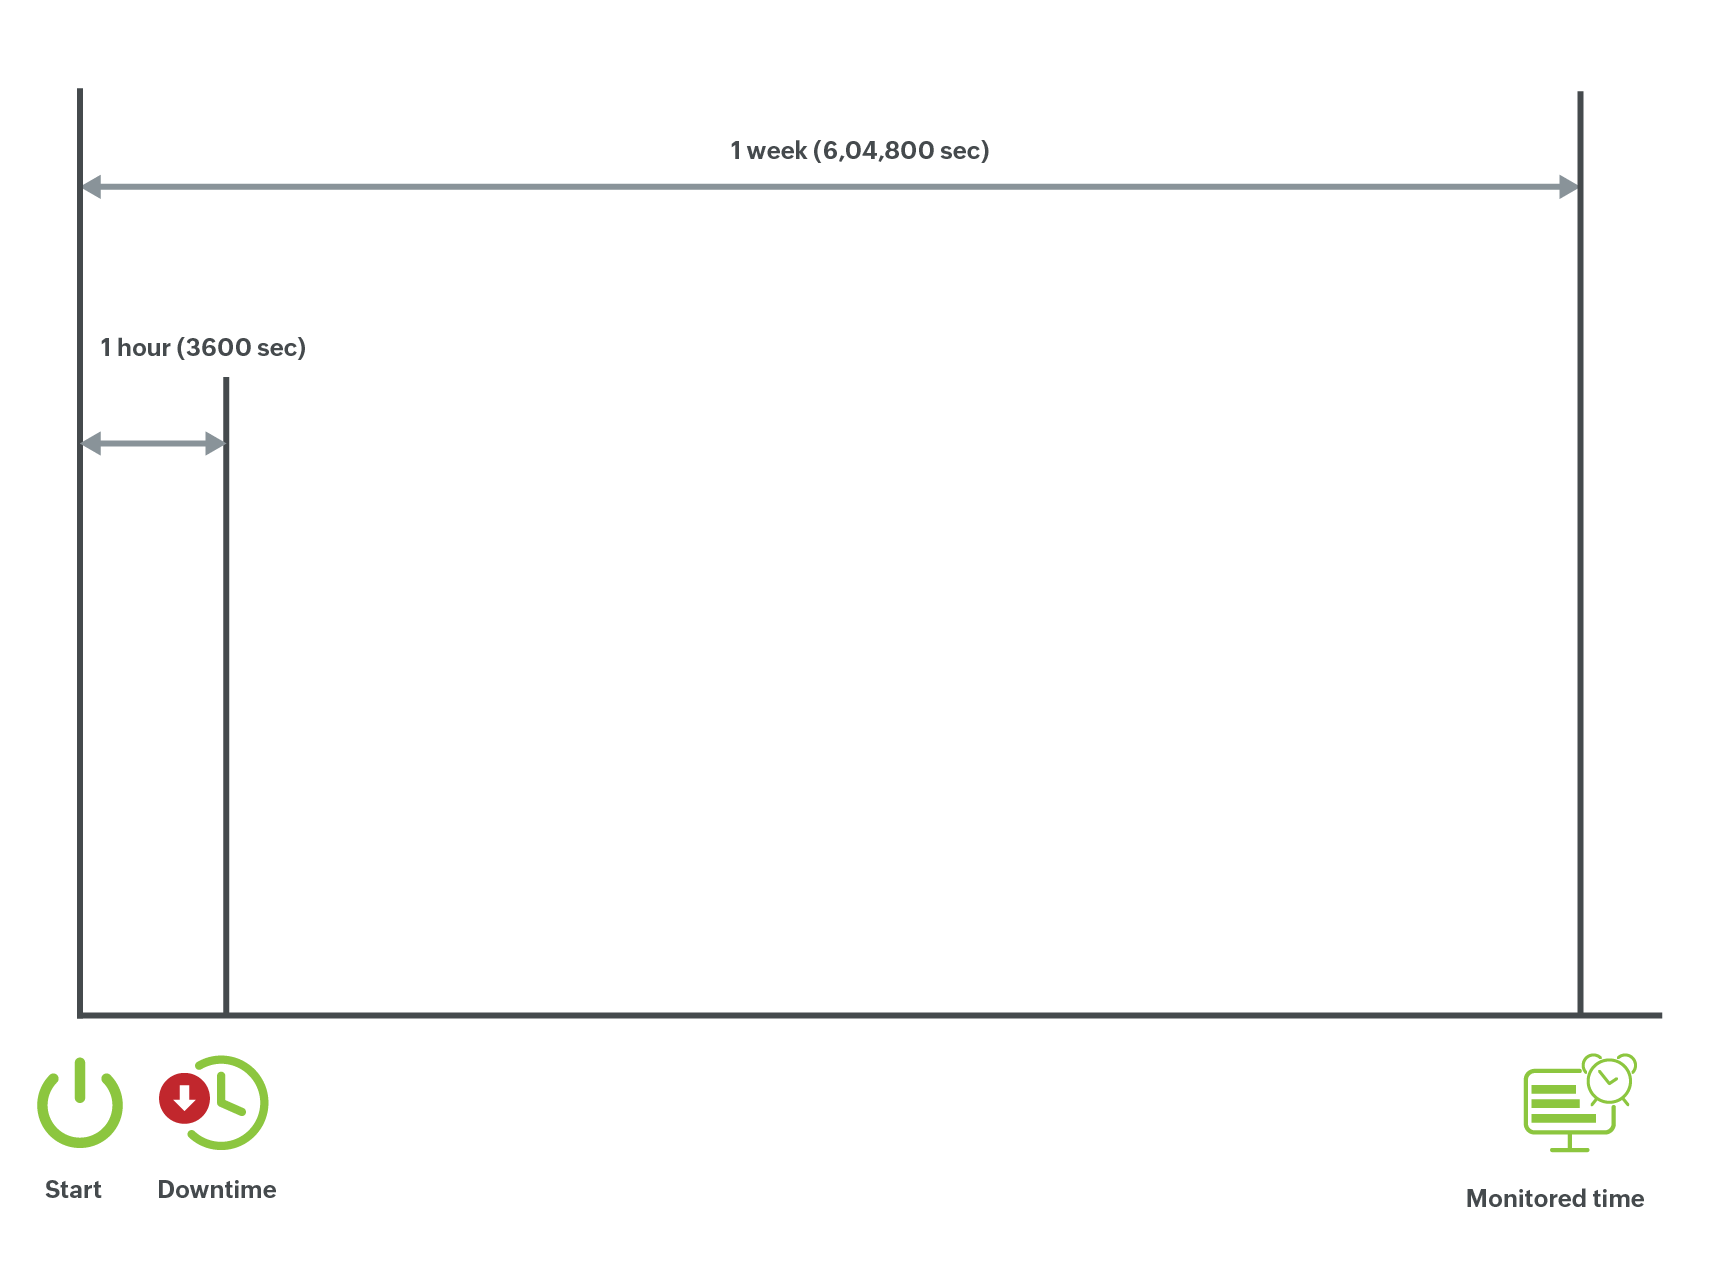
Downtime = Number of seconds device was down / Number of seconds device monitored
= 3600/ 6,04,800 = 0.0059
Downtime %= 0.59%
Uptime % = 100 - Downtime % = 100-0.59 = 99.41 %
Note: On Hold, Maintenance, Dependent Unavailable, Down, Not Monitored is calculated as Device Down duration.

