The FCAPS model of ISO lists fault management as one of the five core functional areas of proactive network management and defines its goal: to recognize, isolate, correct, and log faults that occur in the network.
Network fault management is the process of finding, isolating, and troubleshooting network faults in the fastest way possible. Fault management is a crucial component of network management that minimizes downtime and prevents device failures by resolving faults rapidly, thereby ensuring optimal network availability and preventing business losses.
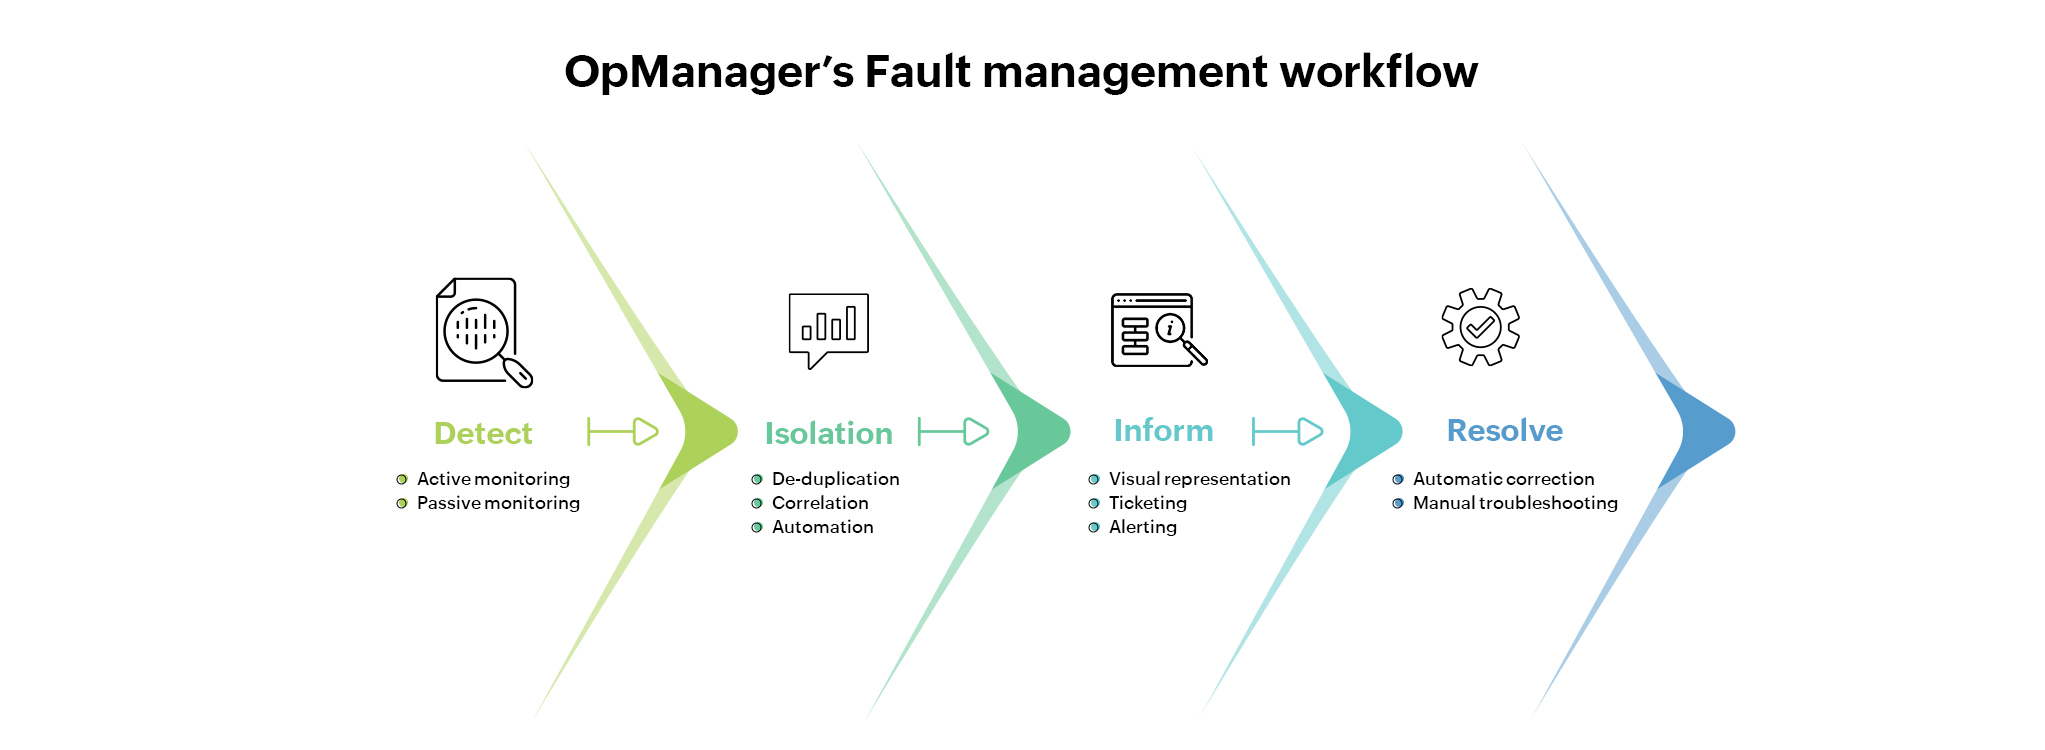
Network fault monitoring is the first step of fault management and thus a requirement for successful network management. The increasing complexity of hybrid network infrastructures would make the fault management process burdensome if not for fault management systems. A fault management tool follows a four-step cycle to resolve issues, as shown below:
Network fault management is all about staying up-to-date with what is happening in your network, be it an unforeseen outage or performance degradation. You can detect, recover, and limit the impact of failures in your network using OpManager, our 24/7 network fault management software. The powerful capabilities of OpManager as a network fault management system help you isolate and resolve faults in no time through a four-step workflow.

Detect network faults in the wink of an eye, even before anyone notices.
OpManager constantly monitors networks for faults and instantly detects when there is performance degradation or a service interruption. The fault detection can be done through active and passive monitoring.
Active fault management detects an event by checking the device status through ICMP ping, TCP or UDP port checks, custom scripts, remote query, and more. This is an active approach to identify and rectify potential issues in real time, sometimes even before they become a fault.
On the other hand, passive or event-based management monitors the network for actual events that indicate faults or failures only after they have occurred. This can be done through SNMP traps, syslog messages, Windows Event Log messages, and more.
The fewer the alerts, the faster the network admin can drill down to the root cause.
Once the problem is detected, identifying its root cause is of utmost importance to improve the resolution time (MTTR). The whole idea of this isolation process is to eliminate redundant events, thereby cutting down on proxy alerts and exhibiting only actionable faults. OpManager does that with the help of the three methods discussed below.
Deduplication
When an event such as high memory utilization is reported and prevails for the next 30 minutes, your tool should not generate multiple alerts by polling every three minutes for 30 minutes. In such cases, OpManager appends recurring events to alarm history, thereby eliminating duplication and preventing multiple alarms for the same fault.
Correlation
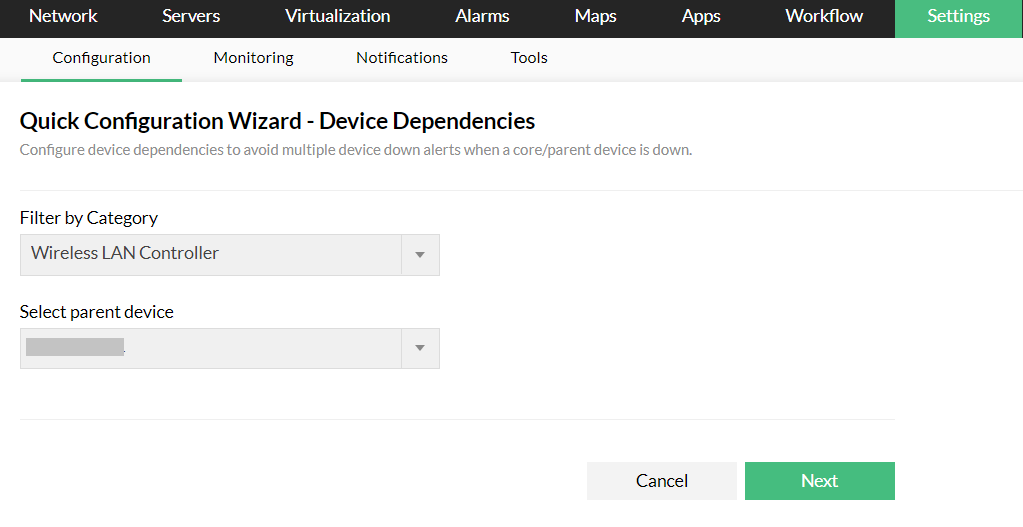
When a core router goes down, it is evident that its dependent devices will go down as well. If your fault management tool raises alarms for all those devices, the amount of time required to identify the root cause of the issue will be much greater. OpManager's Device Dependencies option helps you declare parent and dependent devices, thus averting such false alerts by raising a single alarm for the source device only (in this case, a core router). With the network mapping feature, admins can locate and troubleshoot issues quickly.

Automation
Automation paves the way for faster resolution by dropping unwarranted events (such as negligible, incidental spikes), reverting the alarm status, and suppressing known alarms. The other automations that OpManager offers are:
Be alerted on time, every time!
Once the actionable event is isolated, OpManager notifies NOC admins about it through visual fault representation and notifies remote admins through trouble ticketing and alerts.

Fixing or replacing the event source is the final step to resolution.
Not every detected fault is serious enough to require your immediate attention. In most cases, fault management systems like OpManager run designated scripts or perform workflows at the earliest sign of trouble to automate service restoration and keep the network running. When automation does not work due to errors, OpManager escalates the alarm to the appropriate admins with the event details and the next course of action. So even when you are busy shifting locations and floors to attend to the network's needs, OpManager's fault management tool keeps some faults at bay.
In some cases, such automated resolutions are not possible, so manual intervention is required. You can perform troubleshooting to assess the damage and work out possible quick solutions using the interactive, built-in, web-based troubleshooting tools.

According to a survey conducted by Gartner, the average cost of network downtime for enterprises is around $5,600 per minute, which is over $300,000 per hour on average and up to $540,000 per hour on the high end.
With downtime having such great potential to cause huge losses for businesses, it is essential to take the necessary actions to prevent or minimize it. Preventing downtime and maintaining network uptime come down to monitoring and managing network faults effectively. An advanced fault management solution like ManageEngine OpManager helps admins resolve faults fast, protecting network availability and business revenue.
Register for a free, personalized demo to keep your network fault-free with OpManager.