ManageEngine recognized in the 2023 Gartner® Magic Quadrant™ for Application Performance Monitoring and Observability. Read the report
✕
JBoss monitoring is essential for maintaining the health and performance of your JBoss applications. Applications Manager's JBoss performance monitoring tool end-to-end monitoring for your JBoss servers. With detailed performance metrics, troubleshooting capabilities and powerful reports, JBoss application server performance monitoring can't get easier.
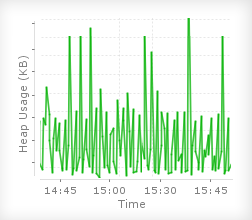
Applications Manager's JBoss monitoring tool enables you to monitor JBoss service response time, the performance of web applications deployed on JBoss as well as components such as Java virtual machine(JVM), Enterprise Java Beans(EJBs), Java database connection pools(JDBC) and servlets. As a result, you get unmatched visibility into the performance of your JBoss server at any point of time.
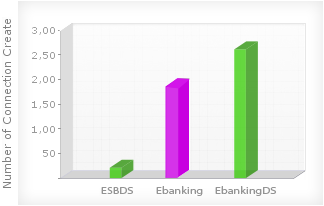
Get visibility into JBoss app performance by monitoring JBoss database metrics like JDBC connection pool size, number of connections in use, and number of connections created/destroyed with our JBoss monitor. You can understand which connection pool setting to adjust to achieve peak performance of your JBoss server. With proper tuning of the JDBC connection pool settings, you can avoid timeouts, reduce overhead to transaction processing and maximizing throughput on hardware.
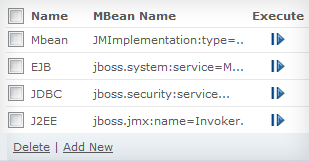
With Applications Manager's JBoss performance monitoring capabilities, you can increase database connection pool size using JMX MBean operations or by restarting the JBoss server when the memory usage exceeds threshold by executing custom scripts automatically. This sort of automation of repetitive tasks reduces manual work for the IT operations personnel.
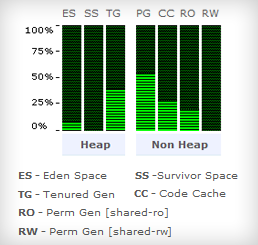
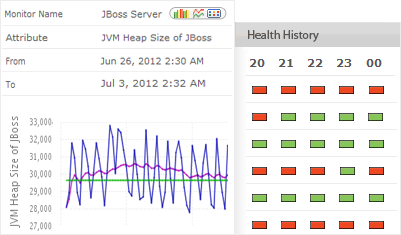
Applications Manager's JBoss monitoring tool enables you to monitor Java heap and non-heap memory and generate a heap dump to troubleshoot a problem. You can also automate taking thread dumps within intervals to identify problematic code. By performing JBoss heap size monitoring, you can learn garbage collection patterns, measure throughput, know about deadlocked threads and analyze other JVM parameters to tune Java performance.
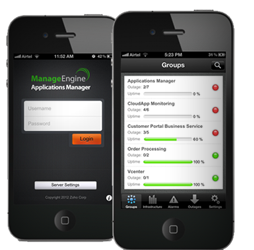
With the mobile web client and the native iPhone app, you can keep tabs on the performance of your JBoss servers on the go. So, in case of a performance issue, you can take corrective action instantly, without waiting to get into office. This effectively increases your productivity when it comes to JBoss monitoring.
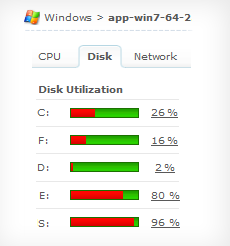
In addition to JBoss monitoring, you can also anticipate resource consumption. By monitoring the KPIs of physical servers, databases, VMs, and public cloud services such as Amazon EC2., you can ensure metrics like log file growth, CPU/disk usage of the database server are well within permissible range.
Identify which resources are utilized well and which are underutilized and plan capacity accordingly. Avoid unpleasant surprises like your application servers suddenly running out of resources.
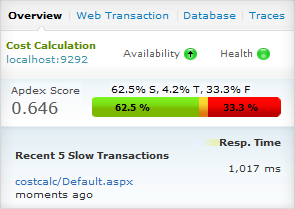
View performance metrics of Java transactions all the way from the URL down to the SQL query that triggered the performance issue.
To accurately gauge database performance, trace transaction flow, and view method level metrics to quickly identify a performance bottleneck, it is advised that the application development team use our transaction monitoring feature alongside our JBoss monitoring ability.
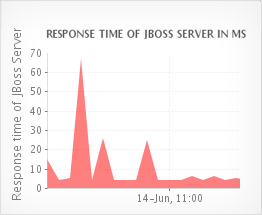
Applications Manager's JBoss performance monitoring capability comes with out-of-the-box reports that help you perform trend analysis, identify bottlenecks, and plan capacity for your JBoss environment - all this without making any configuration changes.
Download Applications Manager's full-fledged, 30-day free trial to experience JBoss monitoring and other features like Wildfly monitoring in a moment's notice!

It allows us to track crucial metrics such as response times, resource utilization, error rates, and transaction performance. The real-time monitoring alerts promptly notify us of any issues or anomalies, enabling us to take immediate action.
Reviewer Role: Research and Development


