ManageEngine recognized in the 2023 Gartner® Magic Quadrant™ for Application Performance Monitoring and Observability. Read the report
✕With its scalable, Unix-based design and various features, macOS has always been a popular choice amongst developers. The sheer number of services makes it hard to monitor system status regularly. This is why macOS monitoring is essential to every IT team's set of tools. Applications Manager's macOS monitoring feature helps you track and optimize your macOS server's performance and ensures 24/7 availability through real-time monitoring.
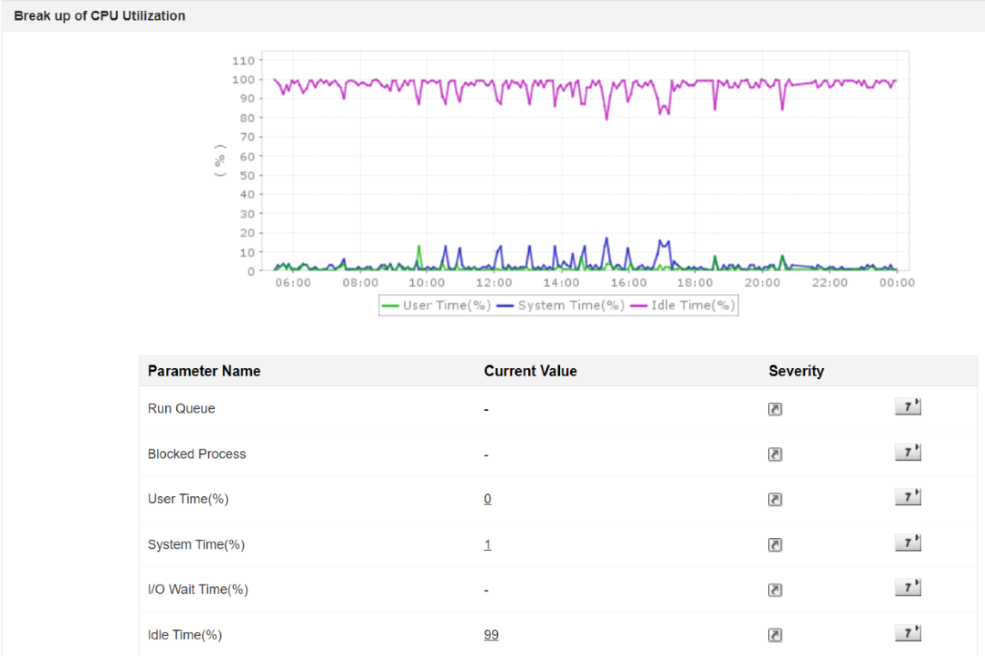
Enabling monitoring for macOS allows you to track your CPU usage, which is a key metric in every system. This information can give you deep insight into whether the CPUs are running at full capacity or if they are being underutilized. If the usage value spikes and crosses a certain threshold, you will be alerted so you can make any changes required to avoid serious performance issues.
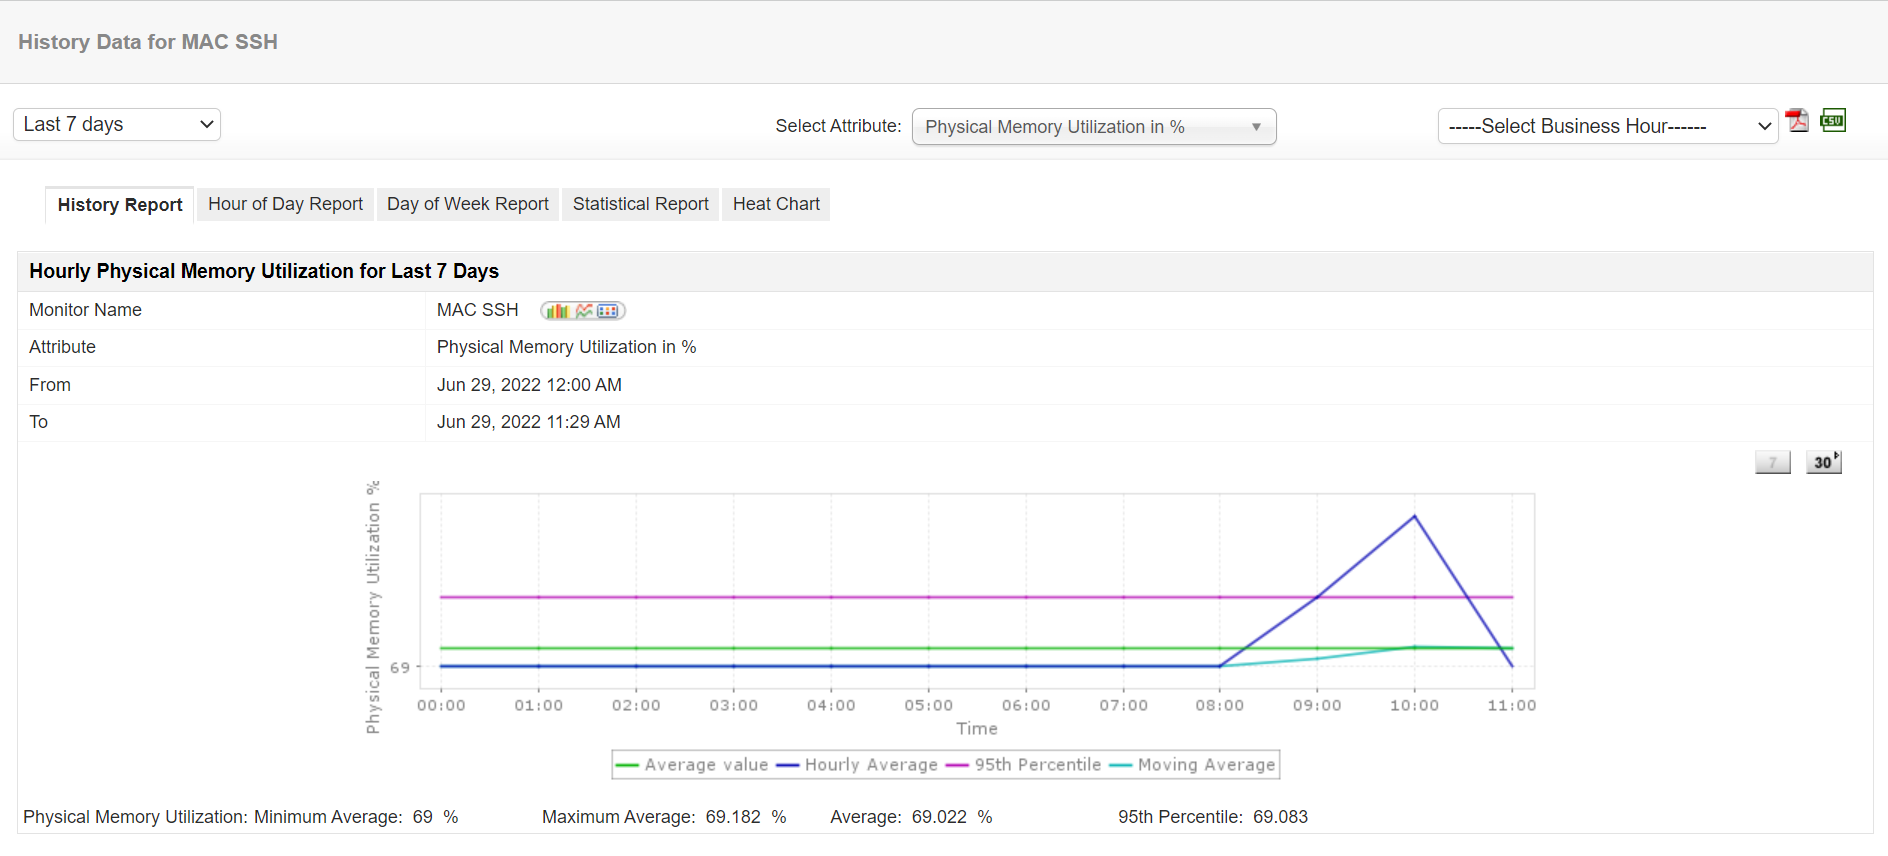
Memory usage is another key component that, when not kept track of, can create a lot of performance issues. Running low on memory space can slow down the performance of your system and even cause certain programs to freeze due to a processor overload. To prevent these scenarios, you can set up Applications Manager to notify you when your memory usage crosses the threshold limit.
Running out of disk space can create performance issues that may force you to halt ongoing activities. Maintaining a margin of available disk space is essential to ensuring a smooth performance. Applications Manager will alert you when your disk space is low so you can rectify any storage issues immediately.

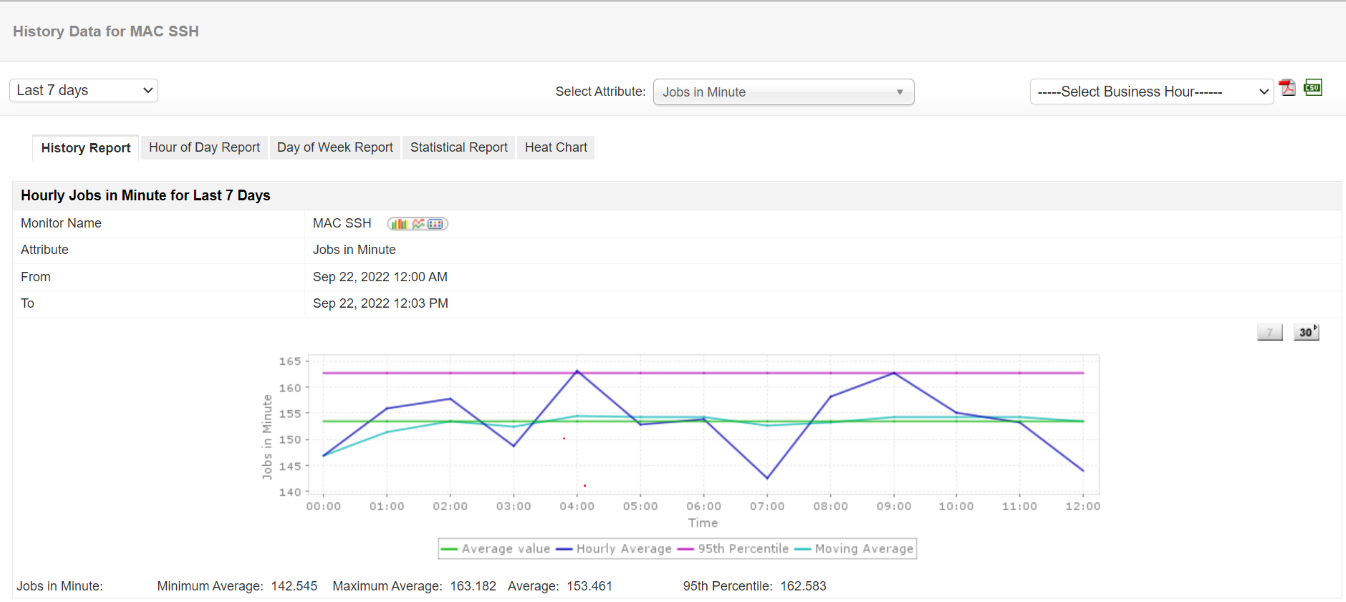
Keep track of the system load feature to measure the number of jobs finished by your system within a certain time period. The higher the number of jobs completed within a time period, the faster the throughput of the system. Applications Manager offers data on the number of jobs completed per minute, every 5 minutes, and every 15 minutes. Users can also configure alarms to be set off for any threshold and attribute. View History reports in the system load tab that displays polled data from any custom period ranging from the current day to the previous year.

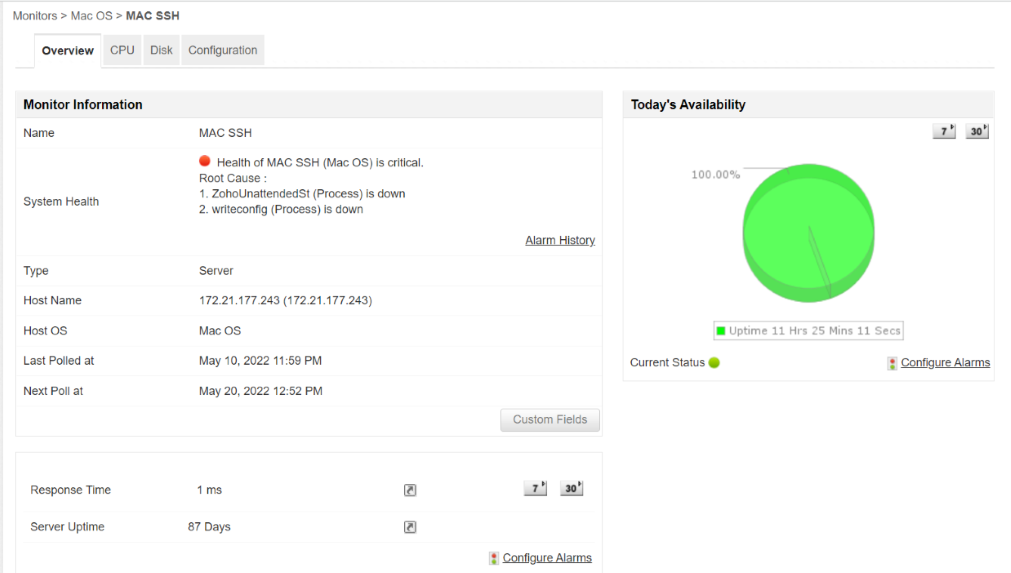
Keeping track of multiple processes is necessary to ensure a smooth, flawless user experience. Applications Manager minimizes manual effort by monitoring all the critical processes running in your system. You will be notified automatically when certain processes fail so you can do what is required to fix the issue.
When Applications Manager detects any problem with your macOS server, it can quickly alert you through multiple channels such as e-mail, SMS and Slack. This enables you to take quick action before your users get impacted. You can automate corrective actions using web hooks to start external actions or even integrate with your ITSM tools such as ServiceNow or ManageEngine ServiceDesk Plus to track the incident further.
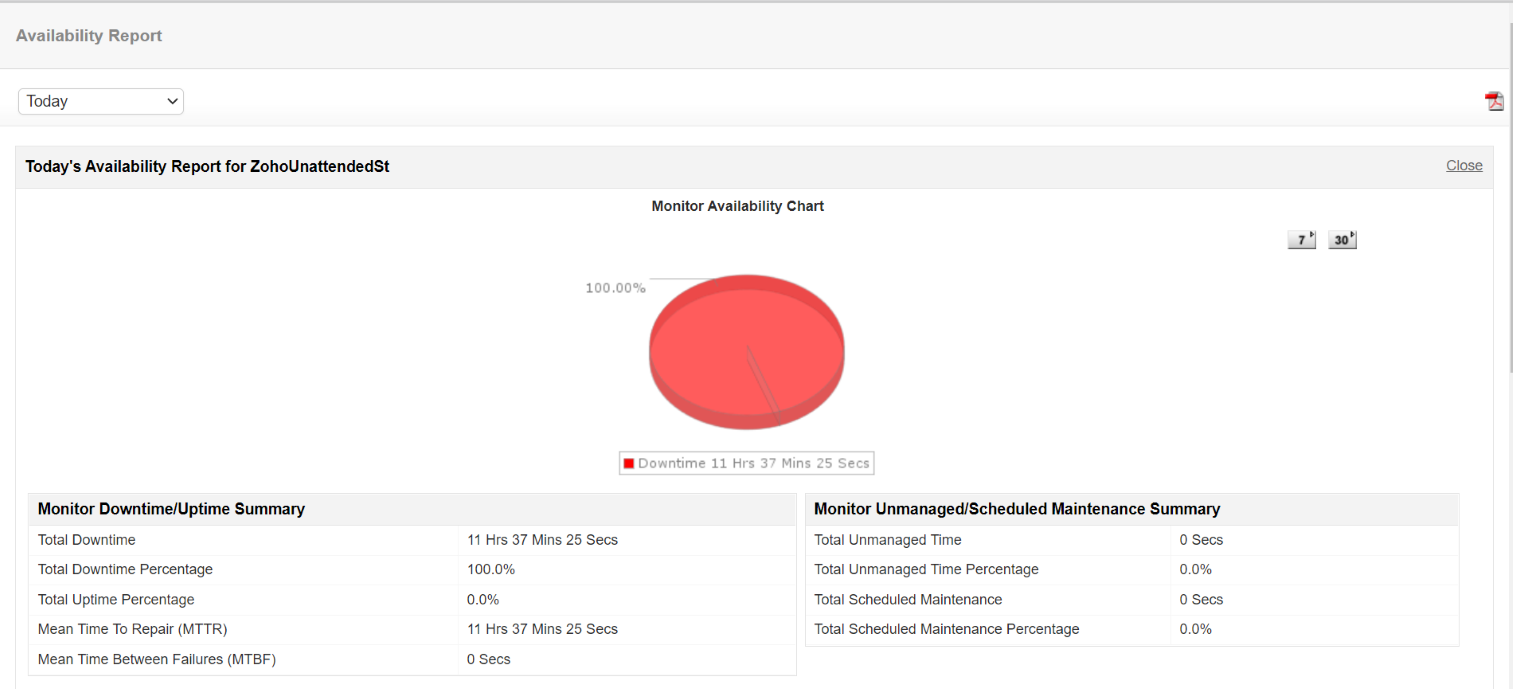
To help you gauge the performance level of your system, Applications Manager offers performance graphs and reports for your convenience. Reports provide insights into your application's performance to help you improve it. For example, the ML-powered forecast reports let you predict future disk utilization and plan accordingly. All the reports can be easily embedded in custom, interactive dashboards and shared with various stakeholders within the organization.
Applications Manager offers agentless monitoring of macOS systems and hence you can get started quickly. All you need to do is to connect to your OS X server through any protocol such as SSH, SNMP or Telnet and specify the relevant credentials for authentication. You can then quickly start collecting data and view availability and performance reports.
If you are already an Applications Manager user, you can start monitoring macOS from your installed version. Alternatively, you can start by downloading our free 30-day trial today and begin monitoring macOS along with the rest of your applications, infrastructure, and services3333—4444all from a single platform.

It allows us to track crucial metrics such as response times, resource utilization, error rates, and transaction performance. The real-time monitoring alerts promptly notify us of any issues or anomalies, enabling us to take immediate action.
Reviewer Role: Research and Development


