Monitoring the network is a crucial part of an admin's job, as it can help prevent critical elements and devices in a network from experiencing downtime. When client devices approach servers with many requests, the load should be evenly shared between servers to avoid any crashes. This is where a load balancer comes in.
Monitoring the network is a crucial part of an admin's job, as it can help prevent critical elements and devices in a network from experiencing downtime. When client devices approach servers with many requests, the load should be evenly shared between servers to avoid any crashes. This is where a load balancer comes in.
Business networks typically have critical servers and applications, such as database servers and exchange servers, which are hosted for high availability. Generally, a load balancer monitor like BIG-IP is used in these networks to share the load between the servers in order to offer uninterrupted services.
Load balancers send requests to the servers for availability and distribute the load to active servers present in a pool.
A server pool is a logical set of servers grouped to process client requests. Usually a pool is formed based on the service it provides, such as IP, HTTPS, File Transfer Protocol (FTP), Transmission Control Protocol (TCP), or User Datagram Protocol (UDP).
Pool member refers to a particular server within the pool. A pool member is associated with a physical node in the network. A server can be a member of multiple pools.
The load balancer constantly monitors all the pool members for performance and directs the client's request to a server based on its availability.
As the demand for your organization's services increases, it can be challenging to handle all the requests. The effort of scaling up the number of servers is futile if only one server is burdened with all client requests.
Load balancers form an integral part of your network; by tracking the health and performance of your servers, they can effectively direct traffic and facilitate continuous network operations.
Any outage or interruption in processing the client requests can prove costly for your business. For example, if a server processing the money transactions in a banking system goes down, it may prevent successful transactions for many customers and negatively affect your business.
Monitoring your load balancer for its health and performance is useful for:
While the uses of a load balancer are invaluable to networks, there are some challenges in real-world scenarios that you may face when monitoring a load balancer, such as:
With OpManager, you can easily monitor load balancers and resolve the challenges mentioned above. By default, during initial discovery, OpManager classifies devices as servers, printers, switches, routers, or firewalls.
OpManager also include built-in device templates for monitoring load balancers. However, even if the device template for your load balancer is unsupported, OpManager offers out-of-the-box monitoring by allowing you to add custom device templates. For example, you can import the device template for your balancer and associate a load balancer monitor to track important metrics proactively.
When you monitor the load balancer metrics, you gain in-depth information about your system's performance. To monitor a load balancer, you should focus on critical parameters like:
OpManager provides the functionality of a powerful network management system and constantly monitors critical load balancing metrics. Listed below are the vital features in OpManager that serve as effective load balancer monitoring tools and help overcome related challenges.
One of the load balancer's most important jobs is to track the availability of servers. It would be unacceptable for a client to experience downtime while performing crucial tasks.
For instance, let's assume that a user follows the procedure to book a train ticket in the online portal, and has proceeded to the payment gateway. Unfortunately, a sad face appears on the screen with a message saying that the service is currently unavailable. This would certainly annoy any customer, and if it continued, could eventually affect the business as a whole.
The load balancer monitor avoids such complications by seamlessly monitoring the servers present in the server pool for availability, ensuring that no server is indiscriminately overloaded.
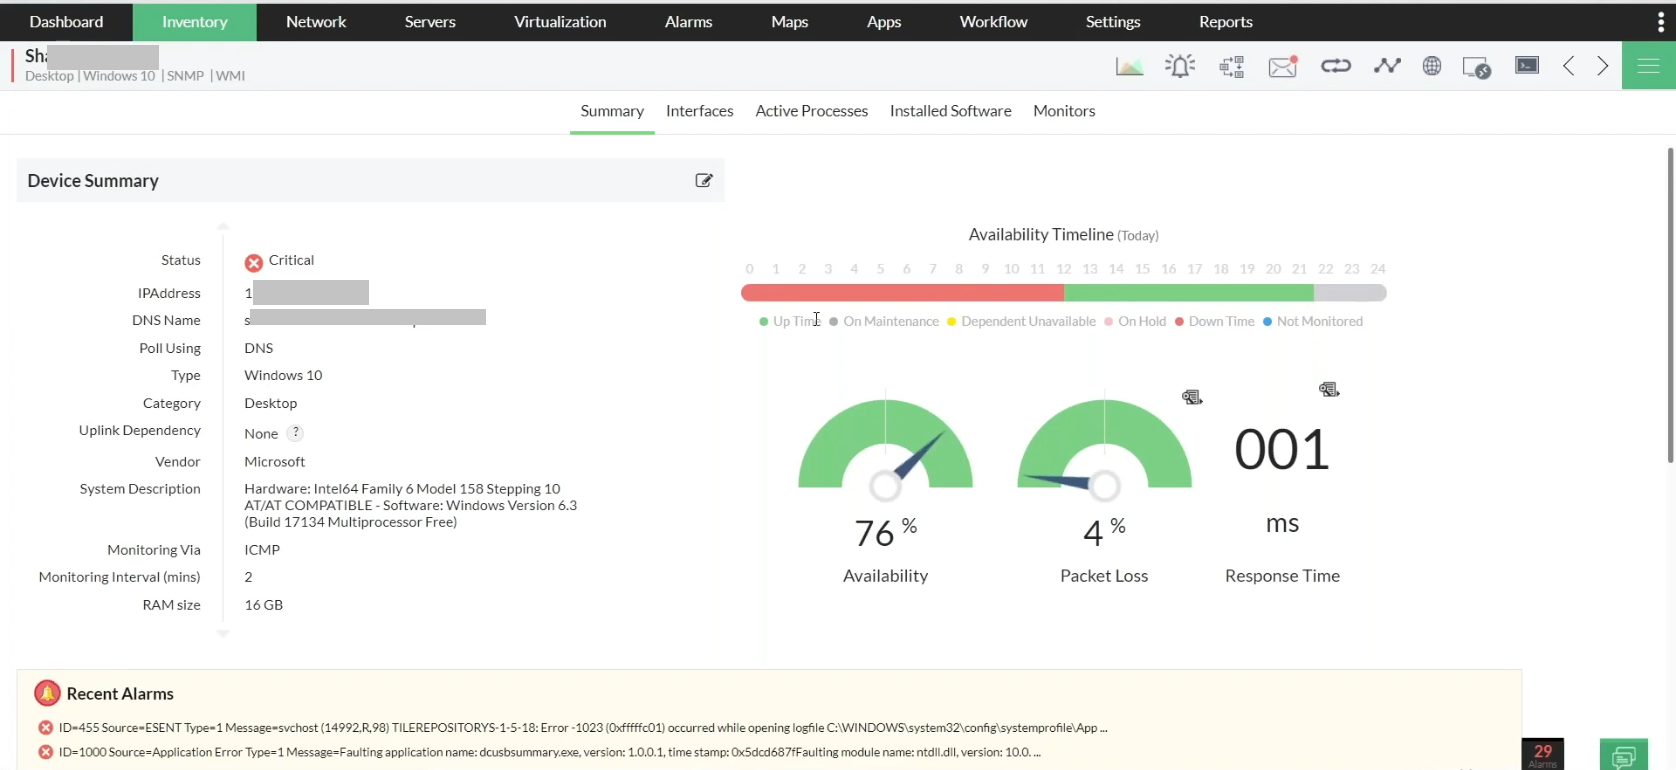
With OpManager, you can easily track the availability of devices in your network. Using the Internet Control Message Protocol (ICMP) Ping, you can identify active devices by sending a ping request to the device.
For devices in a demilitarized zone (DMZ), the ICMP Ping is disabled, but you can monitor devices using the TCP port. In OpManager, availability monitoring is performed by ICMP, TCP, and Simple Network Management Protocol (SNMP) protocols.
Load balancers perform the vital job of allocating services required by the clients to available servers, and are classified based on the service they offer as layer 4 and layer 7 load balancers.
The layer 4 load balancer is based on the networking protocol. It fetches the IP address of the client and routes it to the particular server, which processes the request. Unlike the layer 7 load balancer, it does not inspect the data within the packets that are sent. It establishes a one-to-one TCP connection between the client and server.
The layer 7 load balancers work as per the application layer of the Open Systems Interconnection (OSI) model. A distinguishing feature of this type is that the load balancer inspects the HTTP header and the data present within the packets to make routing decisions based on them. The layer 7 load balancer makes two TCP connections: one with the server, and one with the client.
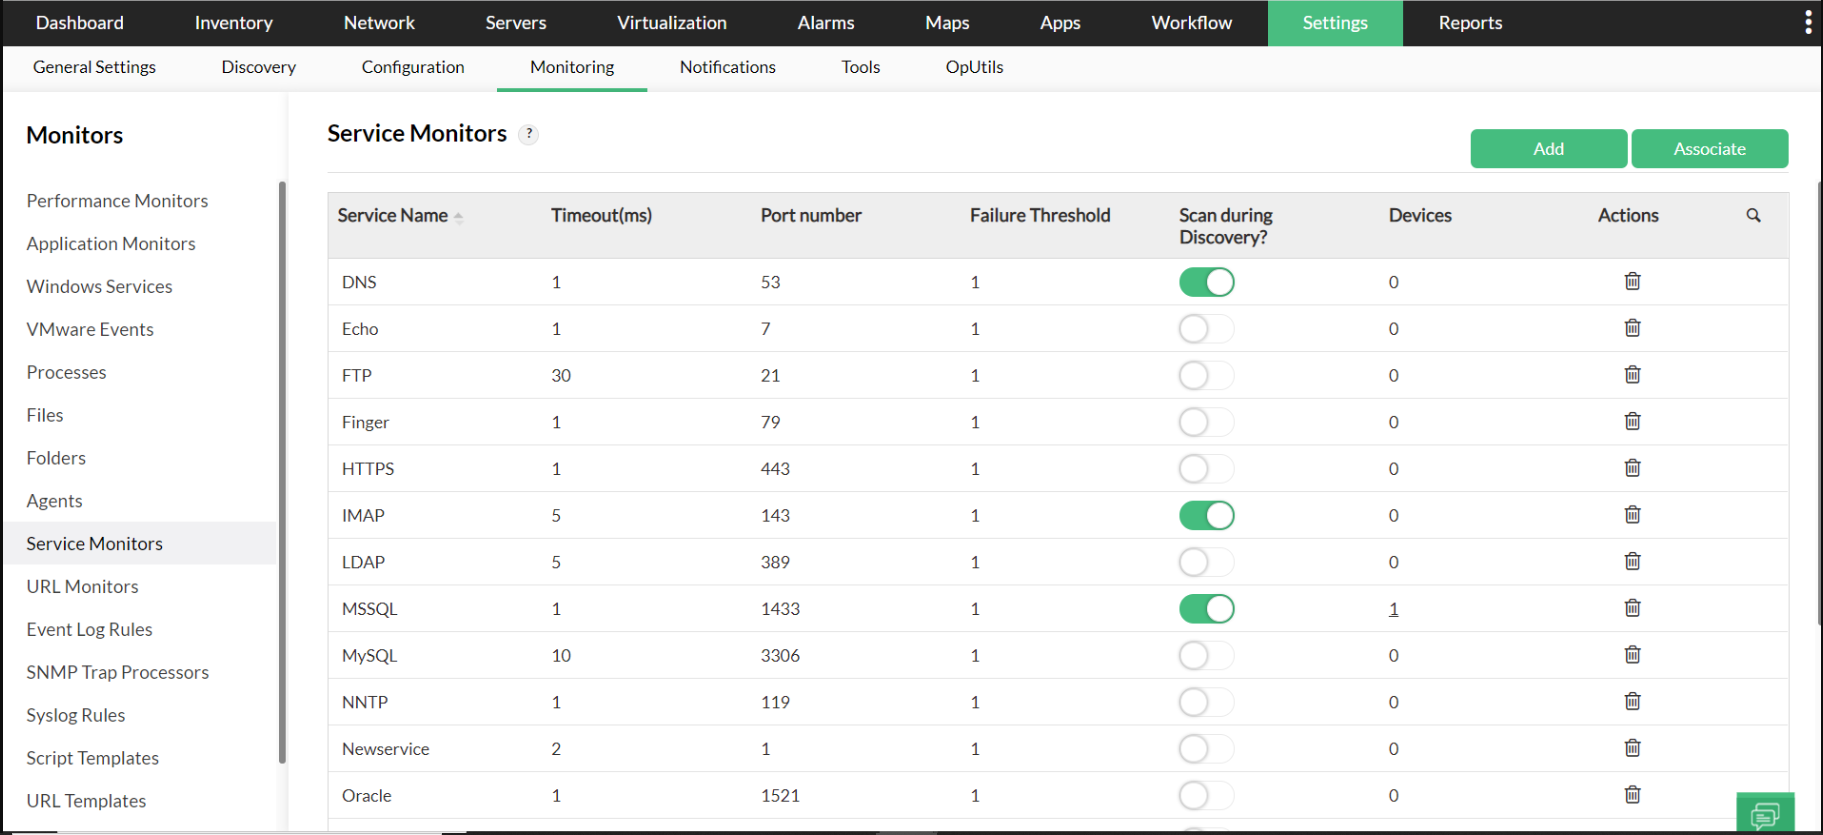
OpManager monitors the services using the TCP protocol. It also monitors the availability and response time for services like HTTPS, IMAP, FTP, etc. Additionally, you can use OpManager to monitor applications running on Windows machines as services using the Windows Management Instrumentation (WMI) protocol.
All processes in your network can be proactively monitored with OpManager using standard SNMP protocols. OpManager also provides support to monitor all processes running on Windows or Linux machines with the WMI protocol and the CLI protocol, respectively.
You can also monitor the usage of system resources like CPU, memory, and instance count by processes.
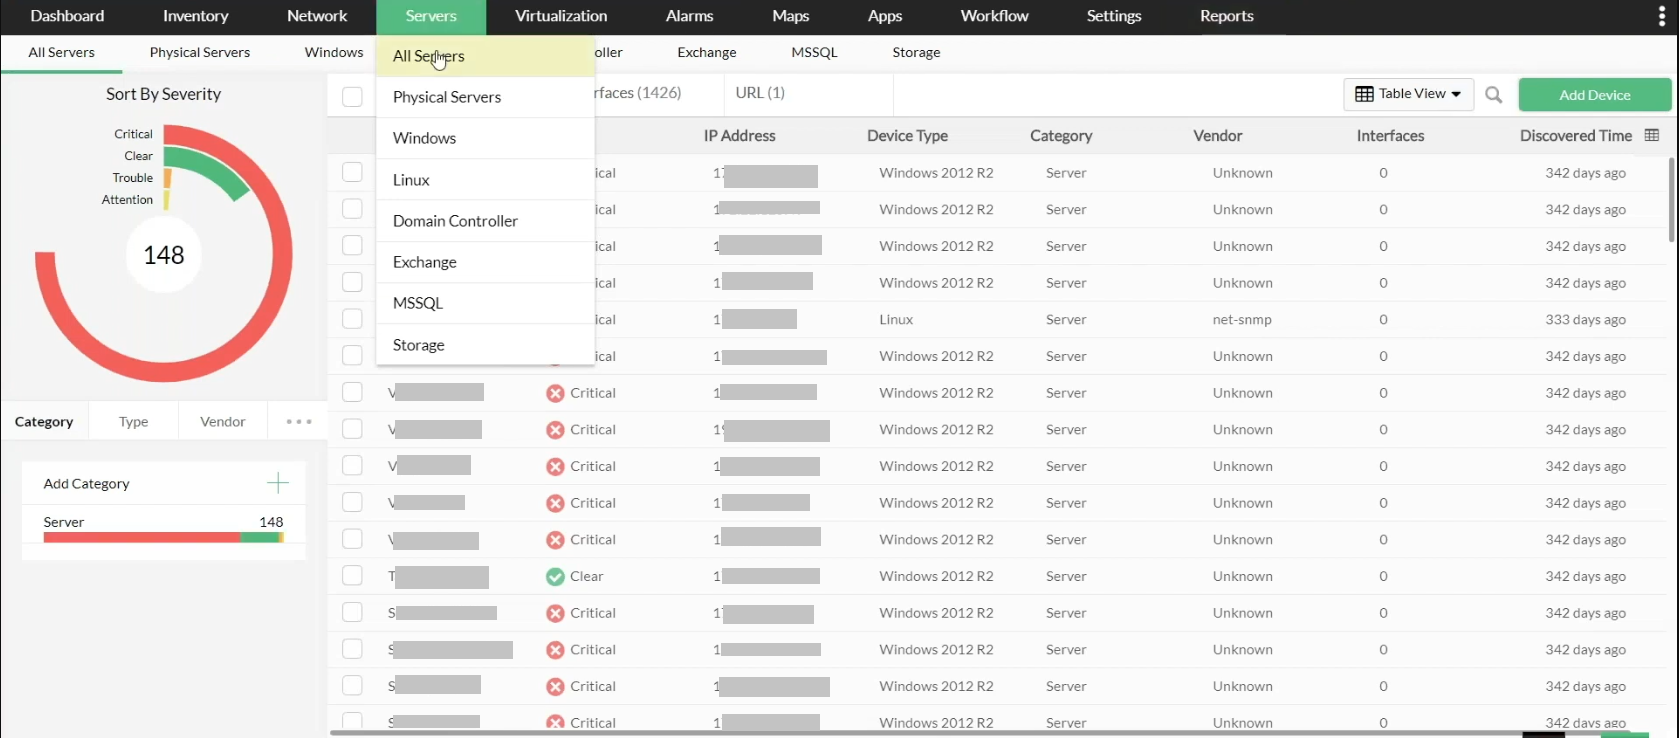
The server, which is a pool member, is a critical element of the network. A load balancing performance monitor helps you constantly monitor a server's health and direct the traffic to it.
Servers are generally grouped into pools based on the service they provide. There is no restriction for a server to operate in one pool, it can be a part of multiple pools as well.
By default, OpManager monitors system resources using the SNMP protocol. However, for non-SNMP devices, you can use the WMI protocol; the system resource monitors are already configured in the Windows device templates.
You can also monitor performance metrics for CPU, disk, memory, etc. OpManager by default supports around 5,000 performance metrics, and you can also add custom metrics and associate them to specific devices.
As a network administrator, you need to be aware of server health and availability, but manually monitoring server performance constantly isn't feasible.
In rare cases when a server goes down, you have to be equipped with efficient fault management tools to resolve the issues quickly and restore normalcy.
OpManager has a robust, built-in fault management mechanism with alarms, notifications, and workflows that enable you to stay informed about issues and resolve them. Alarms are raised based on the severity of a network fault. Predefined color codes assigned to each severity level in OpManager—Attention, Trouble, Critical, Service down, and Clear—help decide what course of action to take based on the gravity of the issue. You can also configure the values of the severity levels for devices.
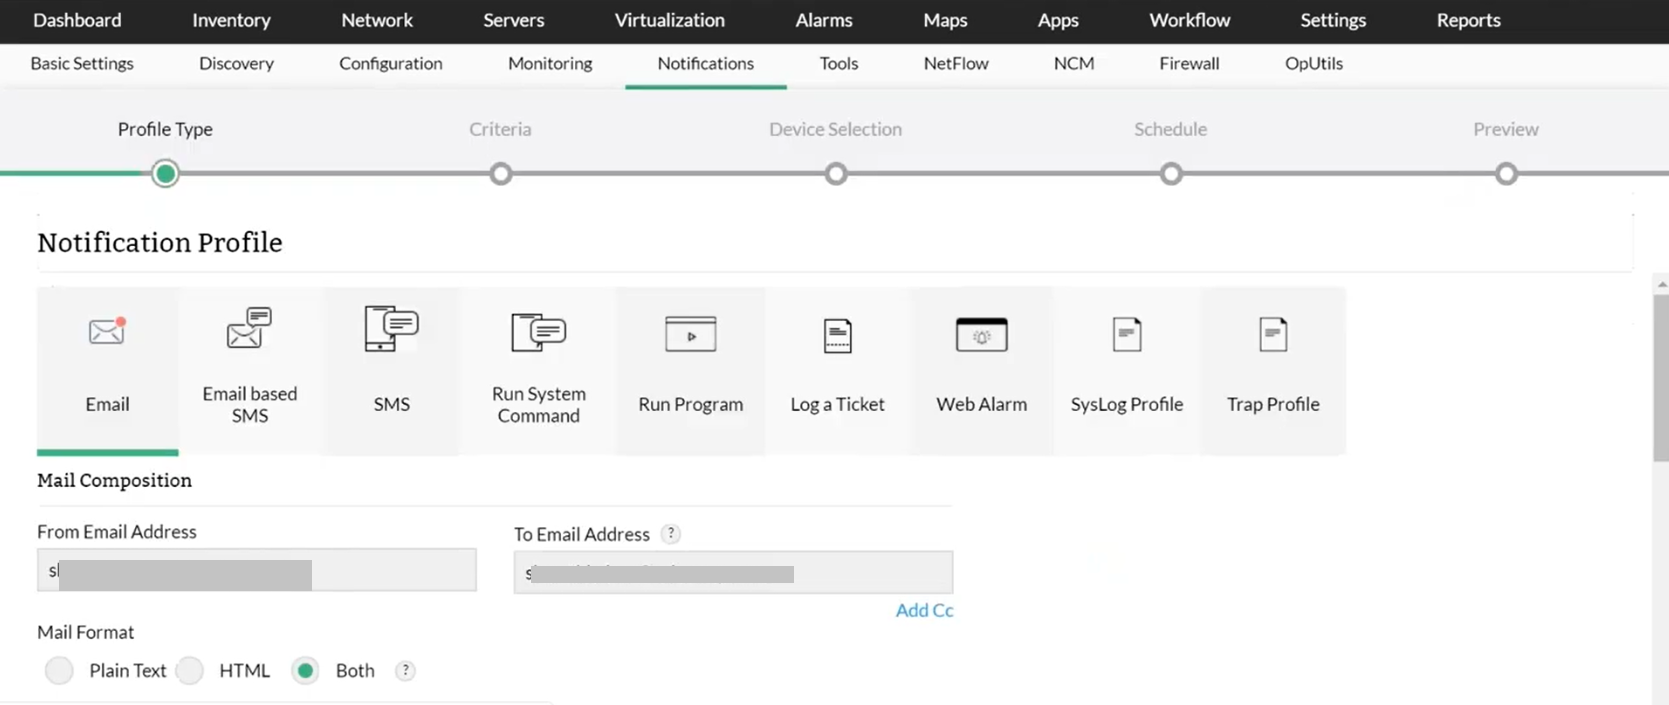
OpManager notifies you about your system's performance even when you're not physically present to monitor your load balancer by utilizing email and SMS to send notifications about a device down or a threshold violation.
With OpManager, you can choose what to monitor based on specific criteria; for example you may decide to monitor downtime for a set of server devices in a pool. You can group the servers of that particular pool and schedule notifications to trigger as needed.
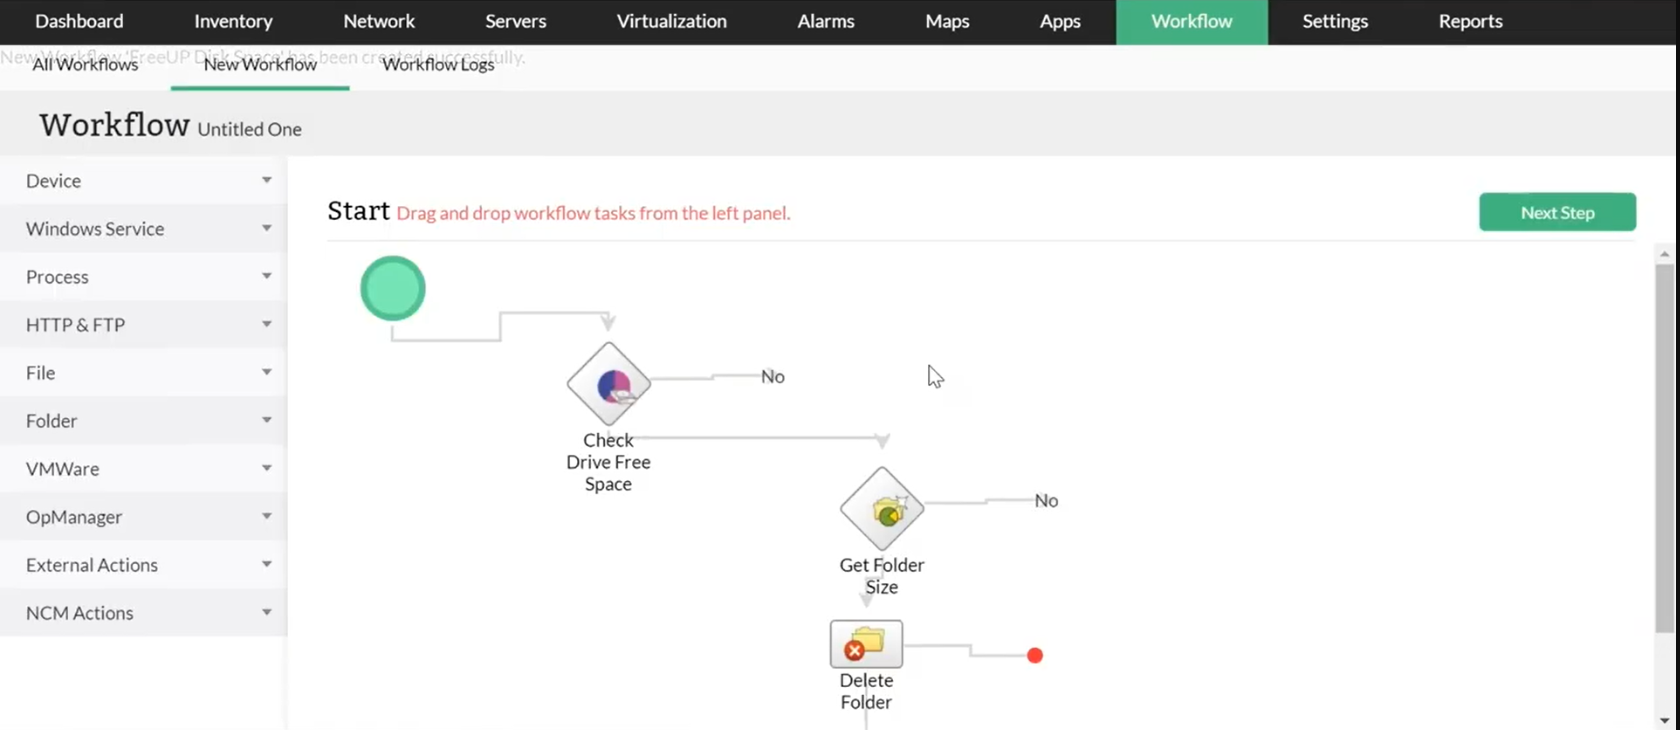
The Workflow feature in OpManager empowers you to automate corrective actions in your IT infrastructure. Using this, you can free up disk space before it reaches a critical level. For example, as and when the disk drive exceeds the configured storage limit, you can program a workflow to delete unnecessary folders. These automations can be created without coding, making OpManager's Workflow feature very user-friendly.
With this smart IT workflow automation feature, you can also configure an alarm to notify you when there is a violation in the configured threshold.
Data, when presented in an appropriate form, can be easily understood, and help you take the right action for your network needs. To be on top of your network while monitoring your load balancer, you need information about multiple metrics simultaneously.
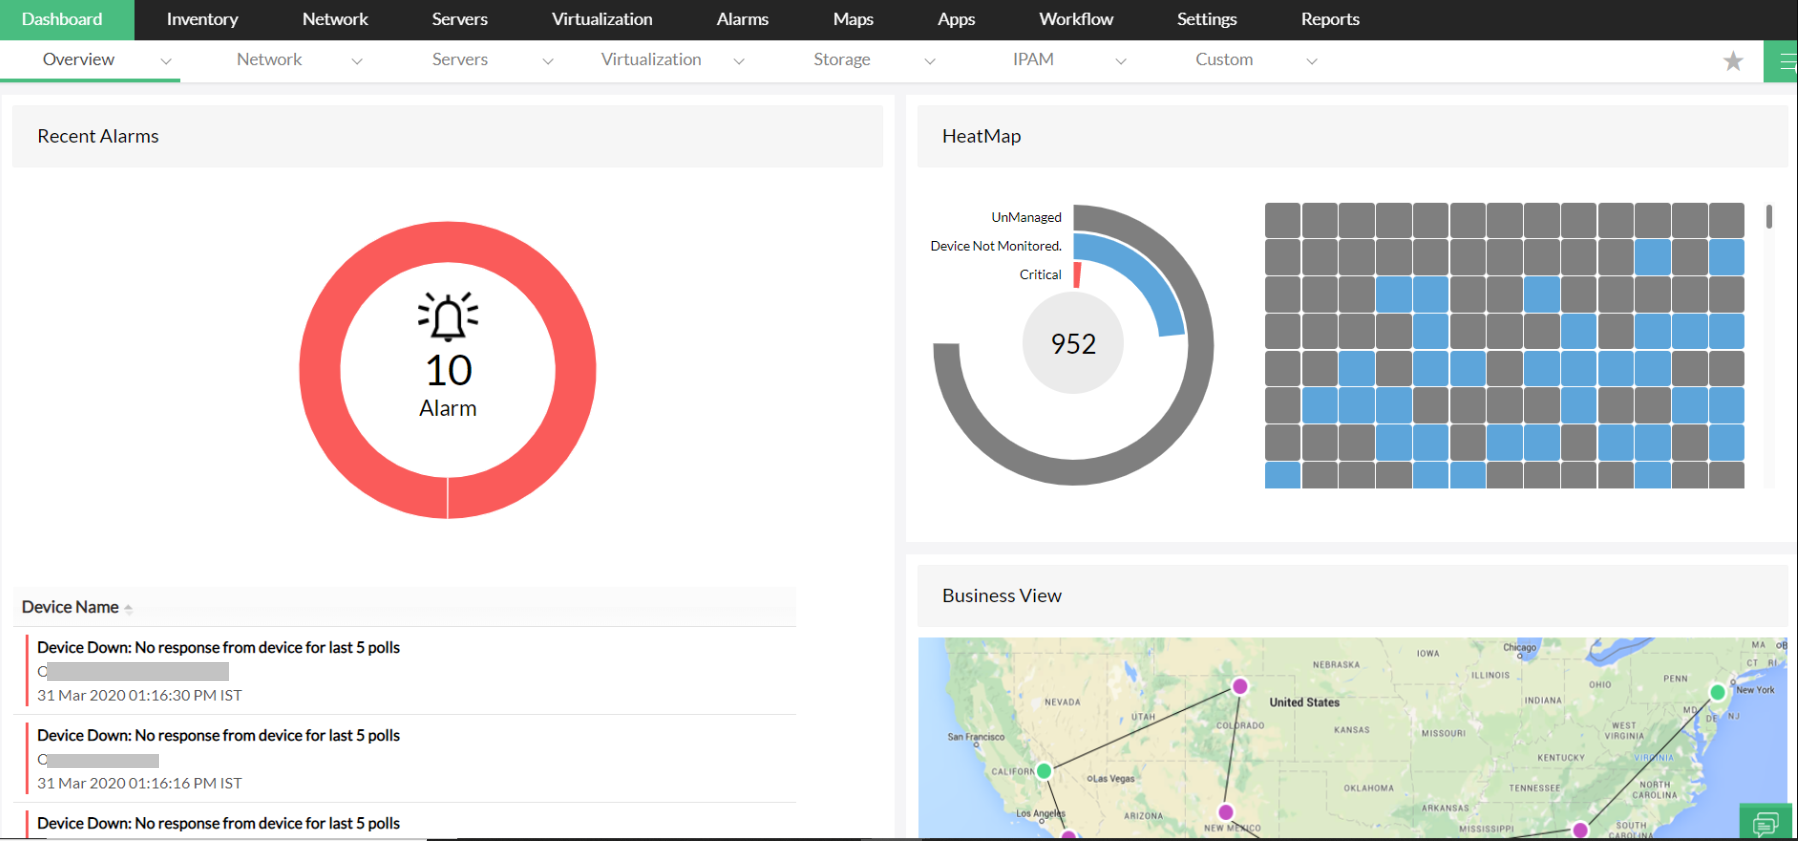
OpManager offers a comprehensive dashboard that allows you to view critical metrics needed for the health and performance of your system. The dashboard provides a broad overview of the status of your network by displaying vital parameters related to servers and services, and the real-time performance graphs allow you to troubleshoot problems on devices. Depending on your business needs, you can customize the dashboard to view the most important metrics at the top and push the other less important ones below.
The intuitive reports available in OpManager enable you to understand network issues and track the performance of devices. For a better experience, OpManager classifies the reports based on system, health and performance, availability and response, inventory, storage, etc.
These reports dramatically reduce the time needed to determine how your system is performing. Once reports are generated, you can even present them to your team by exporting the reports as PDF or XLS files, or schedule them to be emailed to a particular email address.
With proactive monitoring, remedial measures, and the concerted collection of network performance data all in a single window, OpManager is an effective and robust load balancer monitoring tool for enhancing business productivity.