ManageEngine recognized in the 2023 Gartner® Magic Quadrant™ for Application Performance Monitoring and Observability. Read the report
✕Monitor your Kafka ecosystem efficiently, get alerted to problems, and swiftly identify the root cause of production issues with Applications Manager's Kafka monitoring. Go beyond open source Kafka monitoring tools, streamline operations, and optimize the way your engineering teams use Kafka.
In large enterprise environments, the data provided by Kafka can be both massive in quantity and uncovering the metrics is often a difficult task. A lot of businesses use Kafka in application development and delivery, while some use it to perform queuing and to replicate data between data centers (i.e DC-DC replication). If the health of the Kafka server is down, the development and queuing process may get affected and it causes a lag in the delivery of apps. Applications Manager's Kafka monitoring dashboard helps you monitor the important performance metrics related to Kafka such as, brokers, producers, consumers, resource utilization, Zookeeper, etc.
With Applications Manager's Kafka monitoring capabilities, you can:
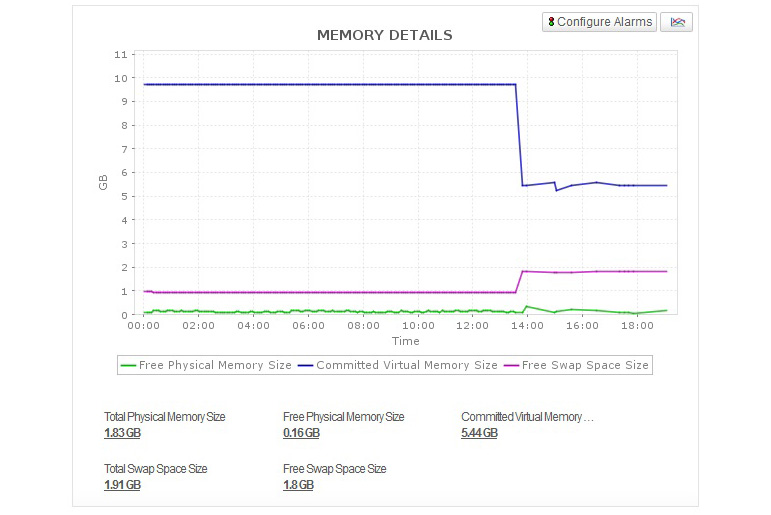
Applications Manager's Apache Kafka performance monitoring feature enables you to automatically discover and monitor Kafka servers, and track resource utilization details, such as memory, CPU, and disk growth. With this data, you can easily identify idle or unused resources and ensure you don't run out of resources. Our Kafka monitoring software will help you make sure your Kafka server is operating as expected at all times. It also alerts you when there is a sudden surge in resource consumption or unusual patterns.

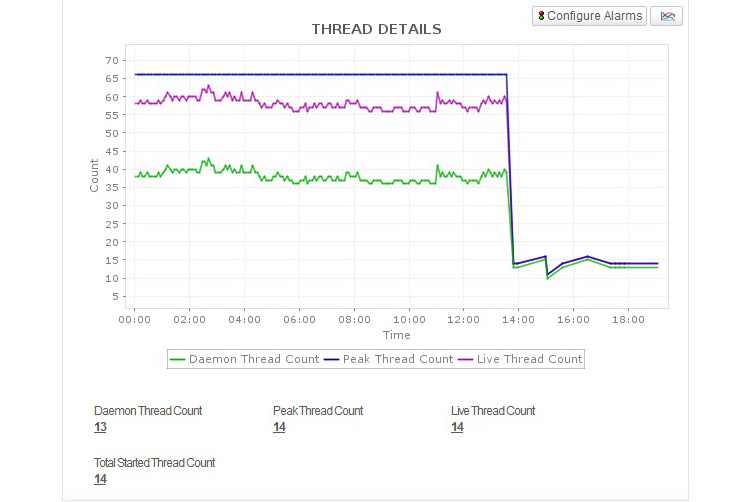
Kafka relies on Java garbage collection processes to free up memory since it runs on the Java Virtual Machine (JVM). With our Kafka monitoring system, track JVM heap sizes to identify any out of memory errors, memory leaks, and other such issues that may occur. You can prevent bottlenecks such as threads overloading the server's memory, thread deadlocks, and thread starvation by tracking thread usage with Kafka performance metrics like daemon, peak, and live thread count to prevent with Applications Manager's Kafka monitor.

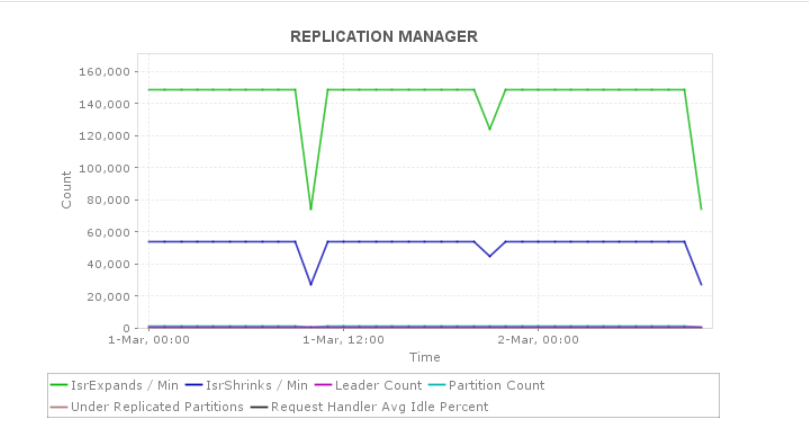
Monitor active controllers to discover the broker that was the controller at the time the issue occurred as well as the exact count of offline partitions. The longer it takes to flush logs to a disk, the more the pipeline backs up; Applications Manager helps keep an eye on broker's log flush latency to prevent any mishaps due to high latency. You can also track under-replicated partitions to see if replication is going as fast as configured using Applications Manager's Kafka monitoring software.

Get a full picture of the network usage on your host and track network throughput or aggregate incoming and outgoing byte rate on your broker topics to locate potential bottlenecks with Applications Manager's Kafka monitor. Make informed decisions such as enabling end-to-end compression of your messages.

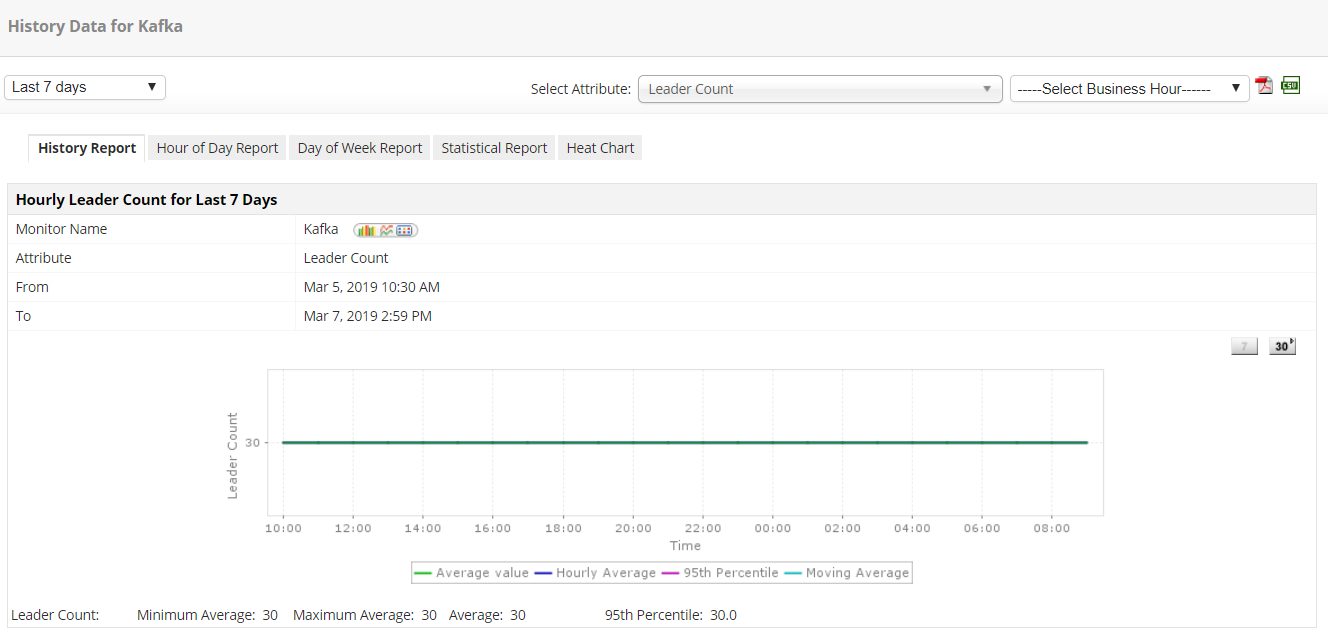
Applications Manager provides extensive reports on all important performance attributes. With these reports, you can analyze the historical trends of various Kafka monitoring metrics to make informed decisions. Predict growth and utilization trends using reports that employ machine learning techniques. You can accurately perform capacity planning and make sure you don't overspend or oversize your resources.

You can use Applications Manager to monitor Kafka performance and the performance of related technologies such as Apache Zookeeper as well as other applications and infrastructure components. Applications Manager provides out-of-the-box monitoring and alerting for 150+ applications and infrastructure elements - both cloud native as well as on premise.
Just enable JMX in your Kafka broker and start monitoring Kafka in Applications Manager by providing the necessary credentials. No need to install or maintain agents. No need to set up separate integrations for alerting and visualization.
Looking to get started with Applications Manager's Apache Kafka monitoring? Download a 30-day free trial of Applications Manager to experience Kafka performance monitoring in just a few minutes!

It allows us to track crucial metrics such as response times, resource utilization, error rates, and transaction performance. The real-time monitoring alerts promptly notify us of any issues or anomalies, enabling us to take immediate action.
Reviewer Role: Research and Development


