Real-time monitoring: Keep in check the critical Hyper-V performance metrics
When it comes to Hyper-V performance monitoring, there are quite a few critical metrics, widely grouped into three types:
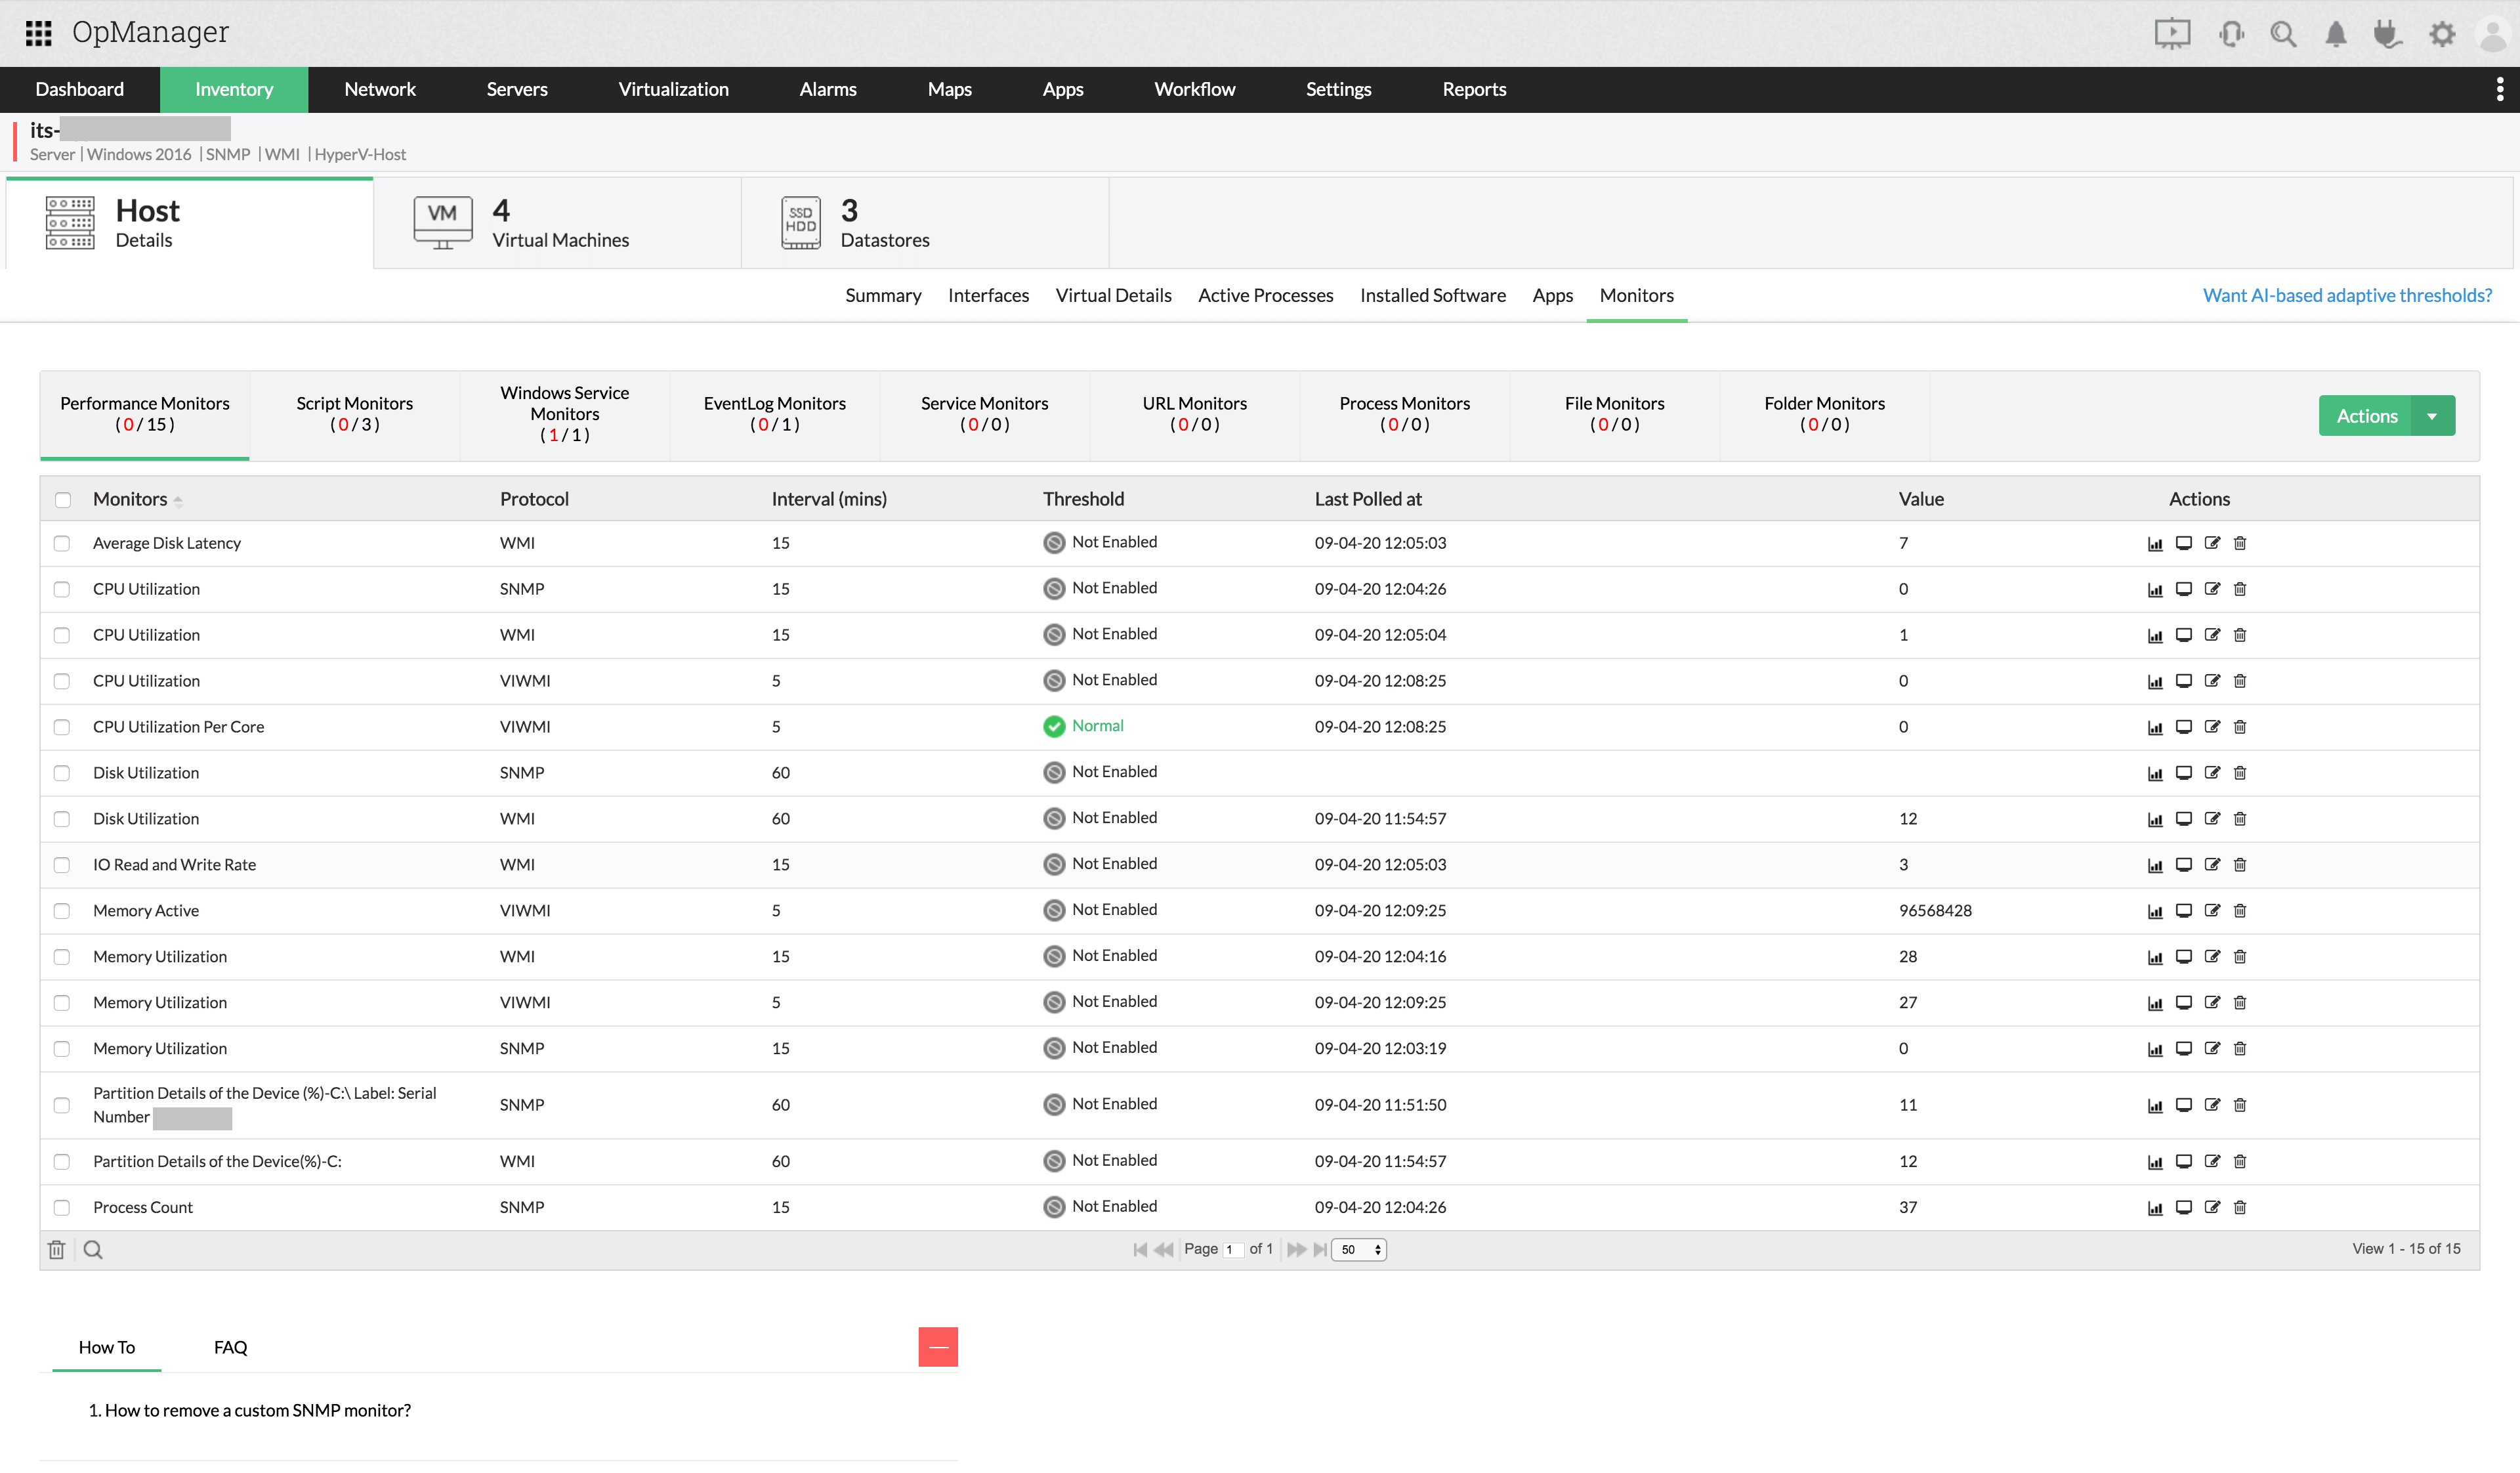
- CPU: Utilization (overall and per core), used/wait/ready time
- Memory: Used memory, free memory, memory consumed, active memory size, and memory overhead
- Disk: Free disk space, partition details of the disk, and also read/write-related stats like read/write speed, read/write latency, and request rate
All of these metrics can be monitored in real time using OpManager's Hyper-V monitoring feature. You can access the performance data of each of these monitors from the Monitors tab in the Snapshot page of the host or VM. Apart from displaying the last polled value and its timestamp at a glance, you can also click any of the monitors to view graphs on the history of that metric for a time frame of your choice.
Fault management: Alerts promptly on Hyper-V performance issues
Hyper-V performance monitoring with OpManager lets you set thresholds of various levels to know when a Hyper-V device is underperforming. OpManager offers three conditions—Attention, Trouble, and Critical—and allows you to set different threshold values for each of these conditions. When any of these conditions are violated, OpManager raises web alarms in the UI to notify you immediately.
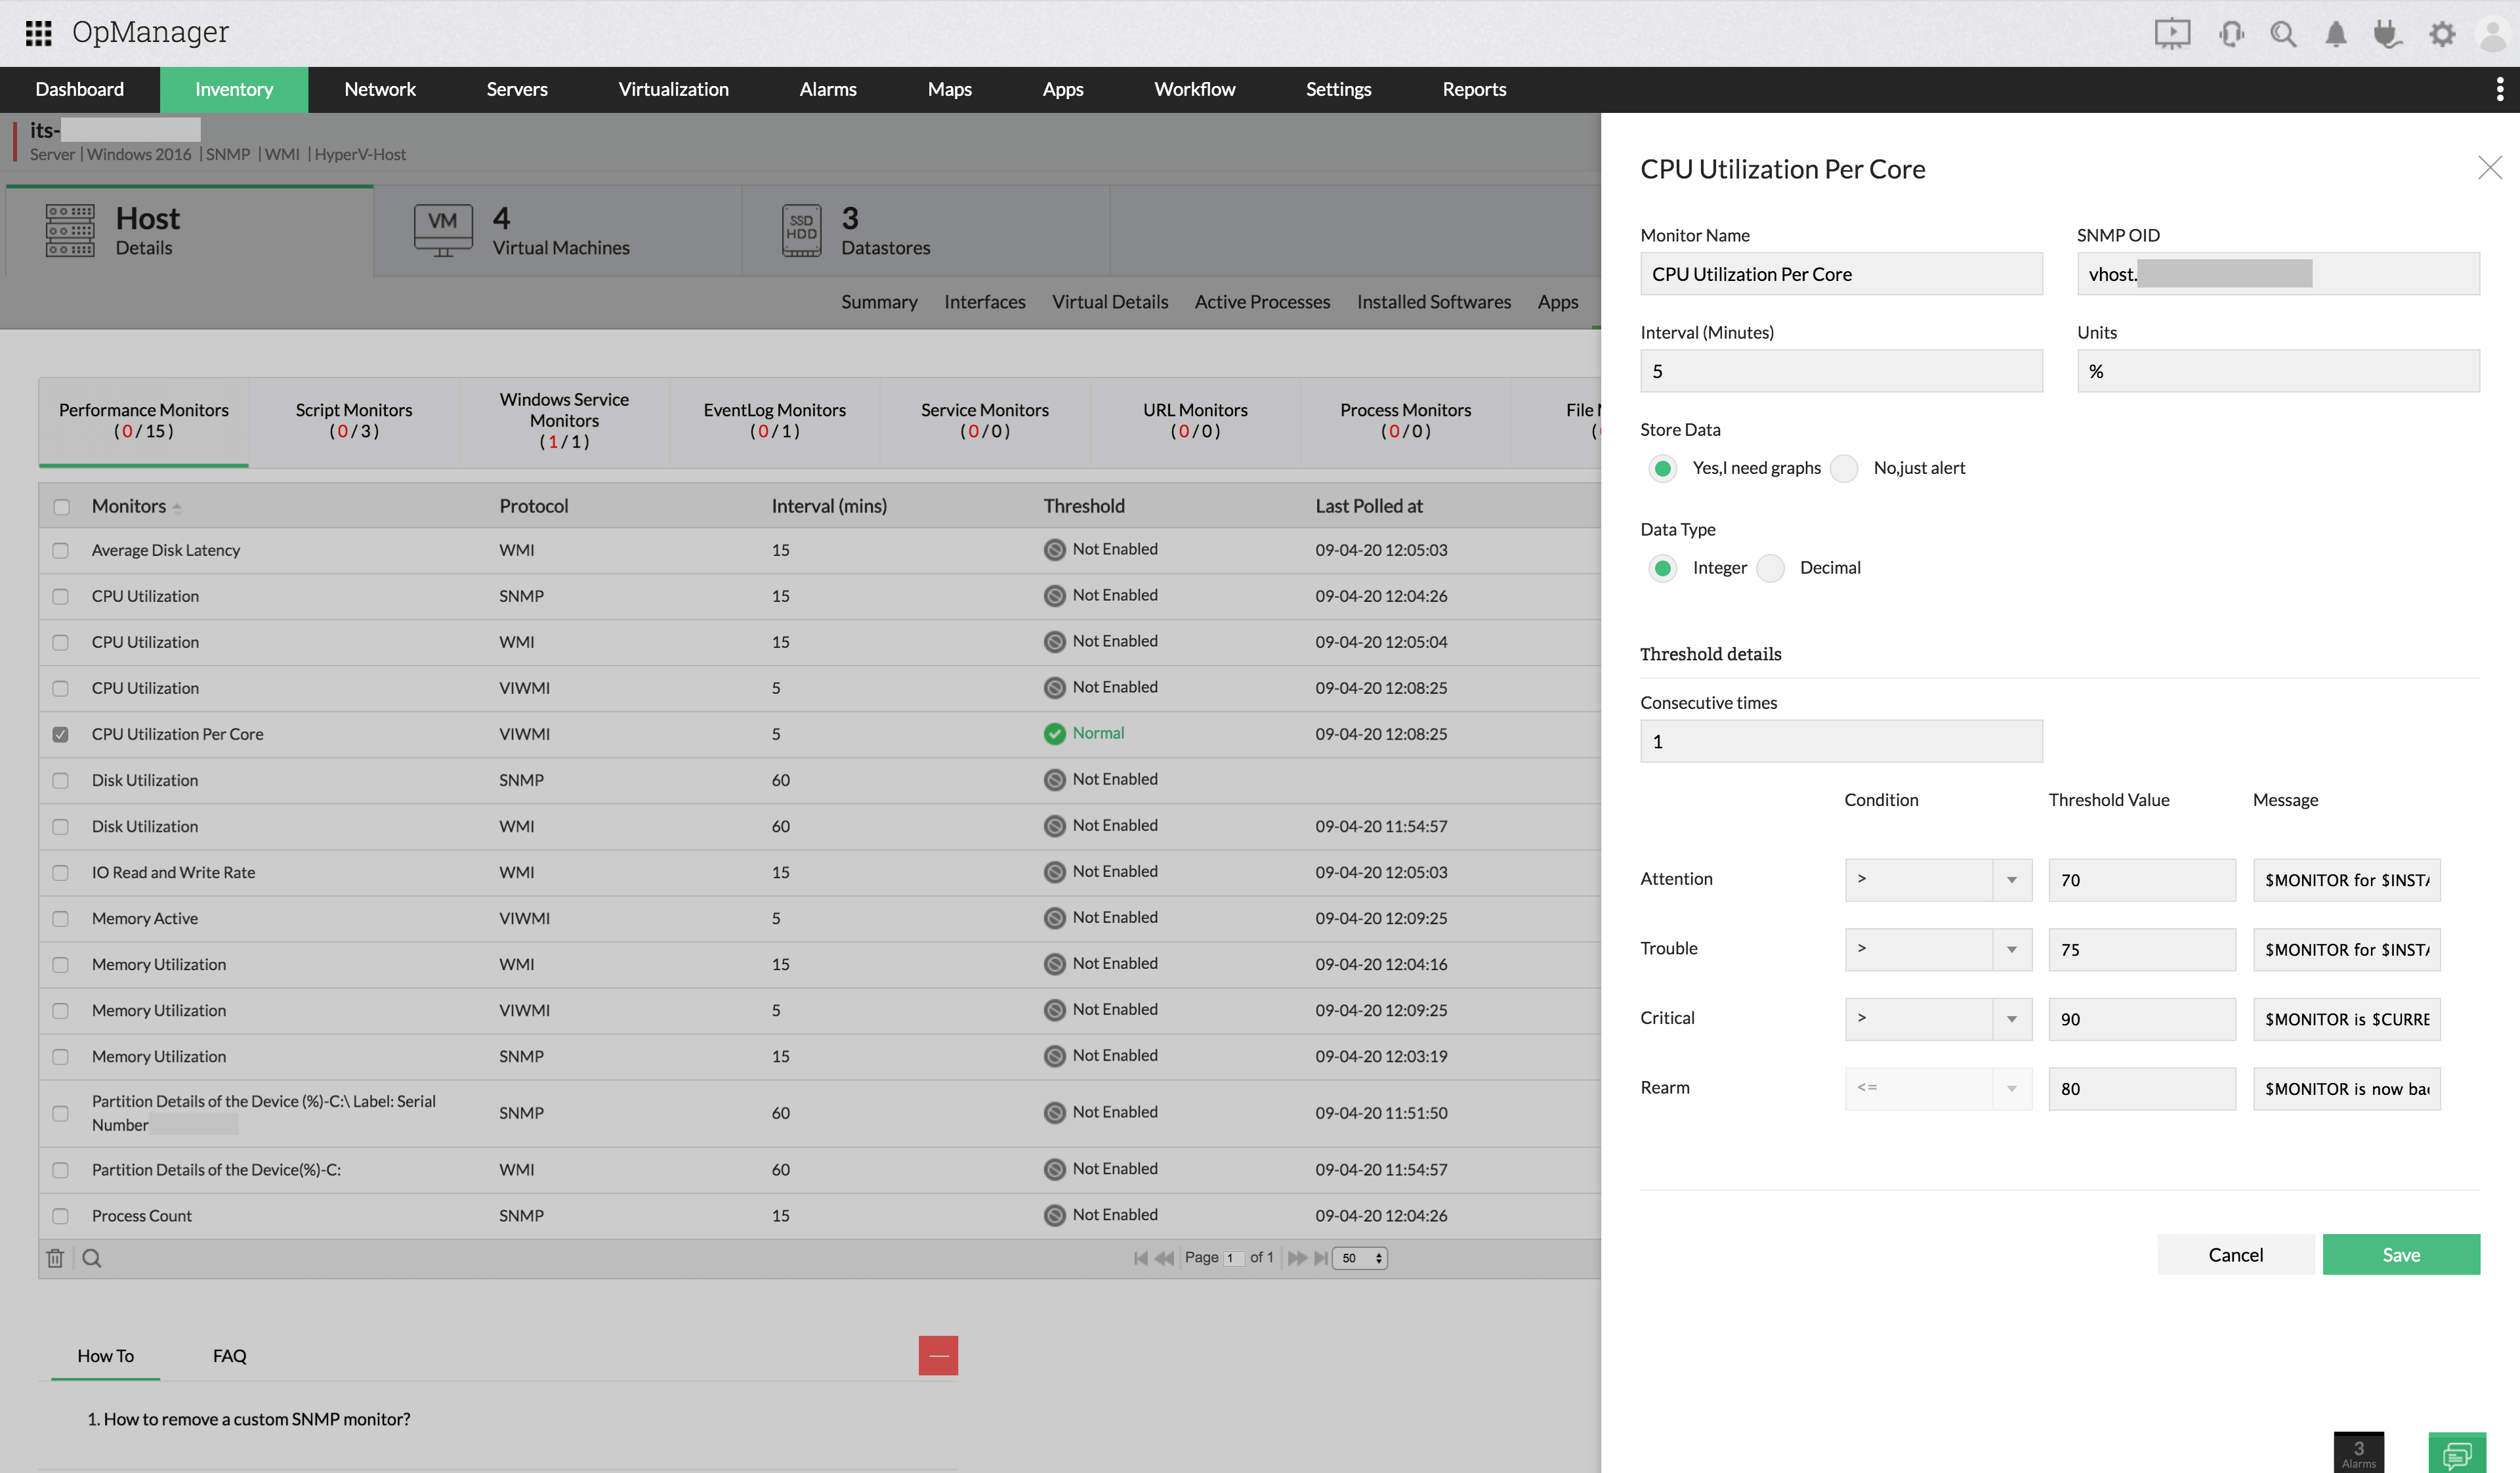
In addition to that, OpManager's Hyper-V performance monitoring feature lets you configure Notification Profiles to alert you over different media such as emails or text messages, or even create tickets on a service desk software such as ServiceDesk Plus or ServiceNow.
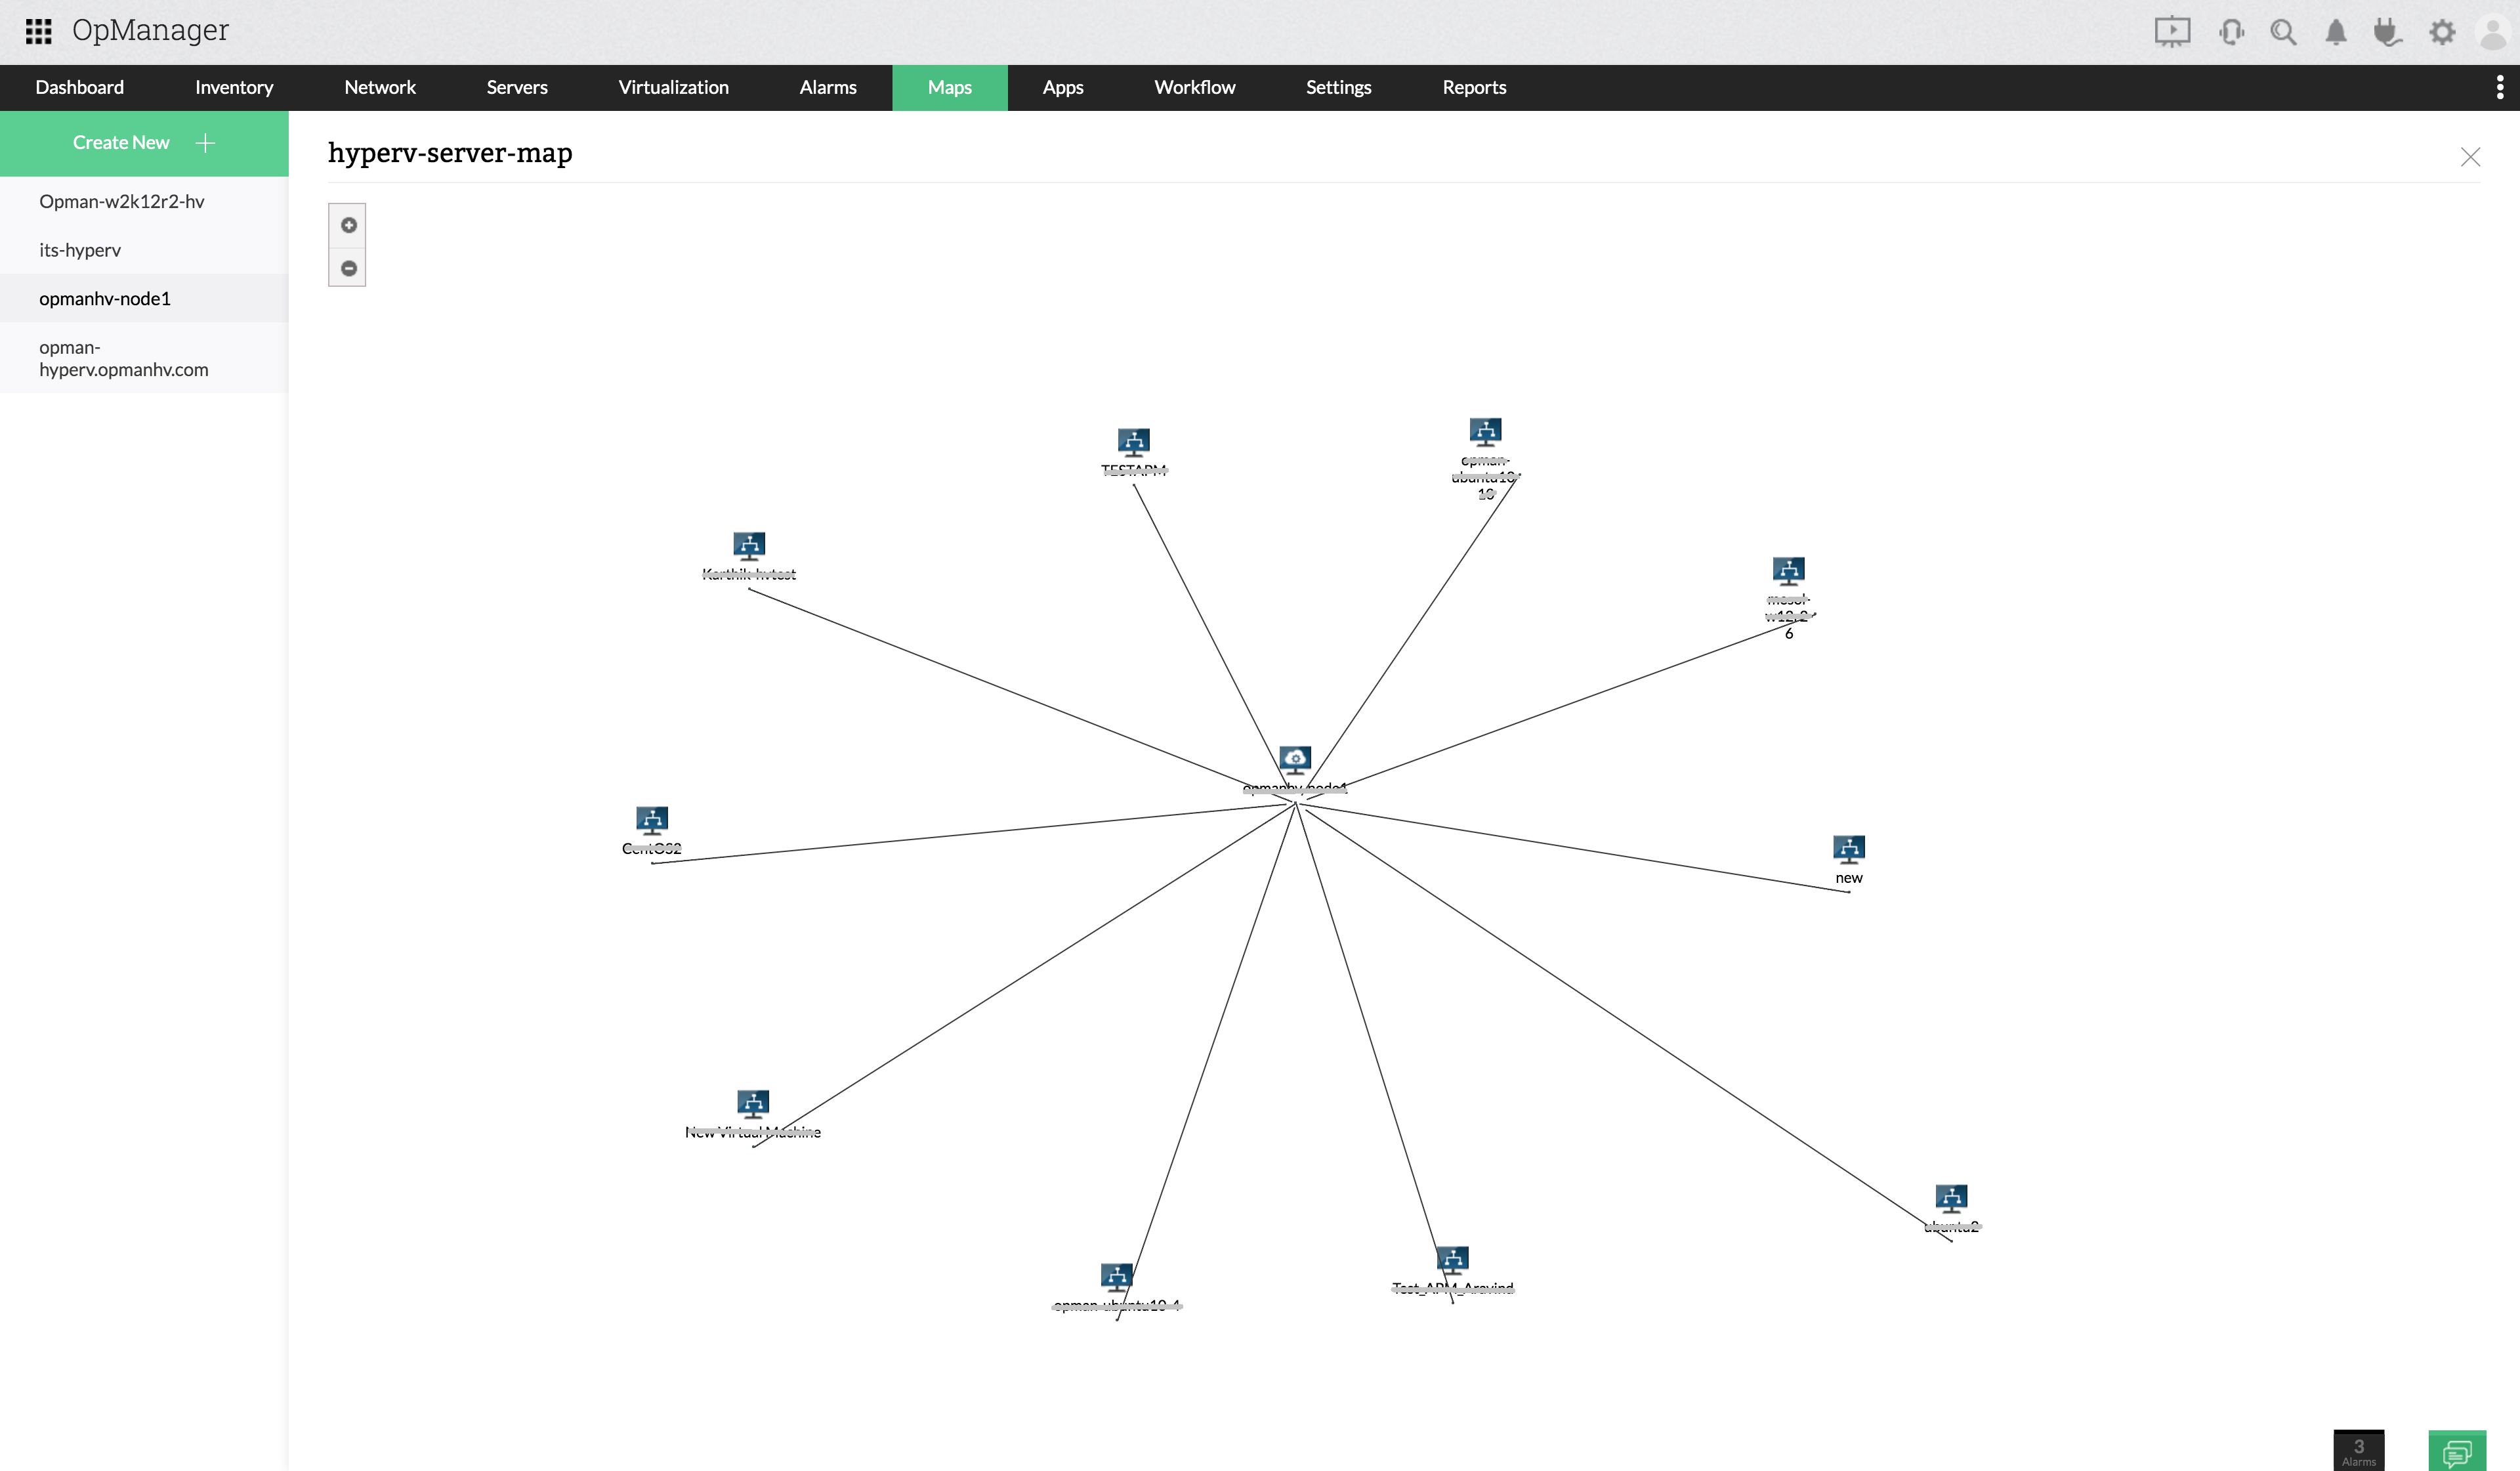
Hyper-V visualization: Visualize device dependency and manage Hyper-V resources better
Whenever you discover a Hyper-V host in OpManager, it automatically discovers all the hosts, VMs, and storage devices under that host, and creates a dependency map of all its Hyper-V resources. With one click, you can visualize the dependency of your entire Hyper-V network, complete with the host and all the VMs under it with the Hyper-V performance monitoring feature of OpManager.
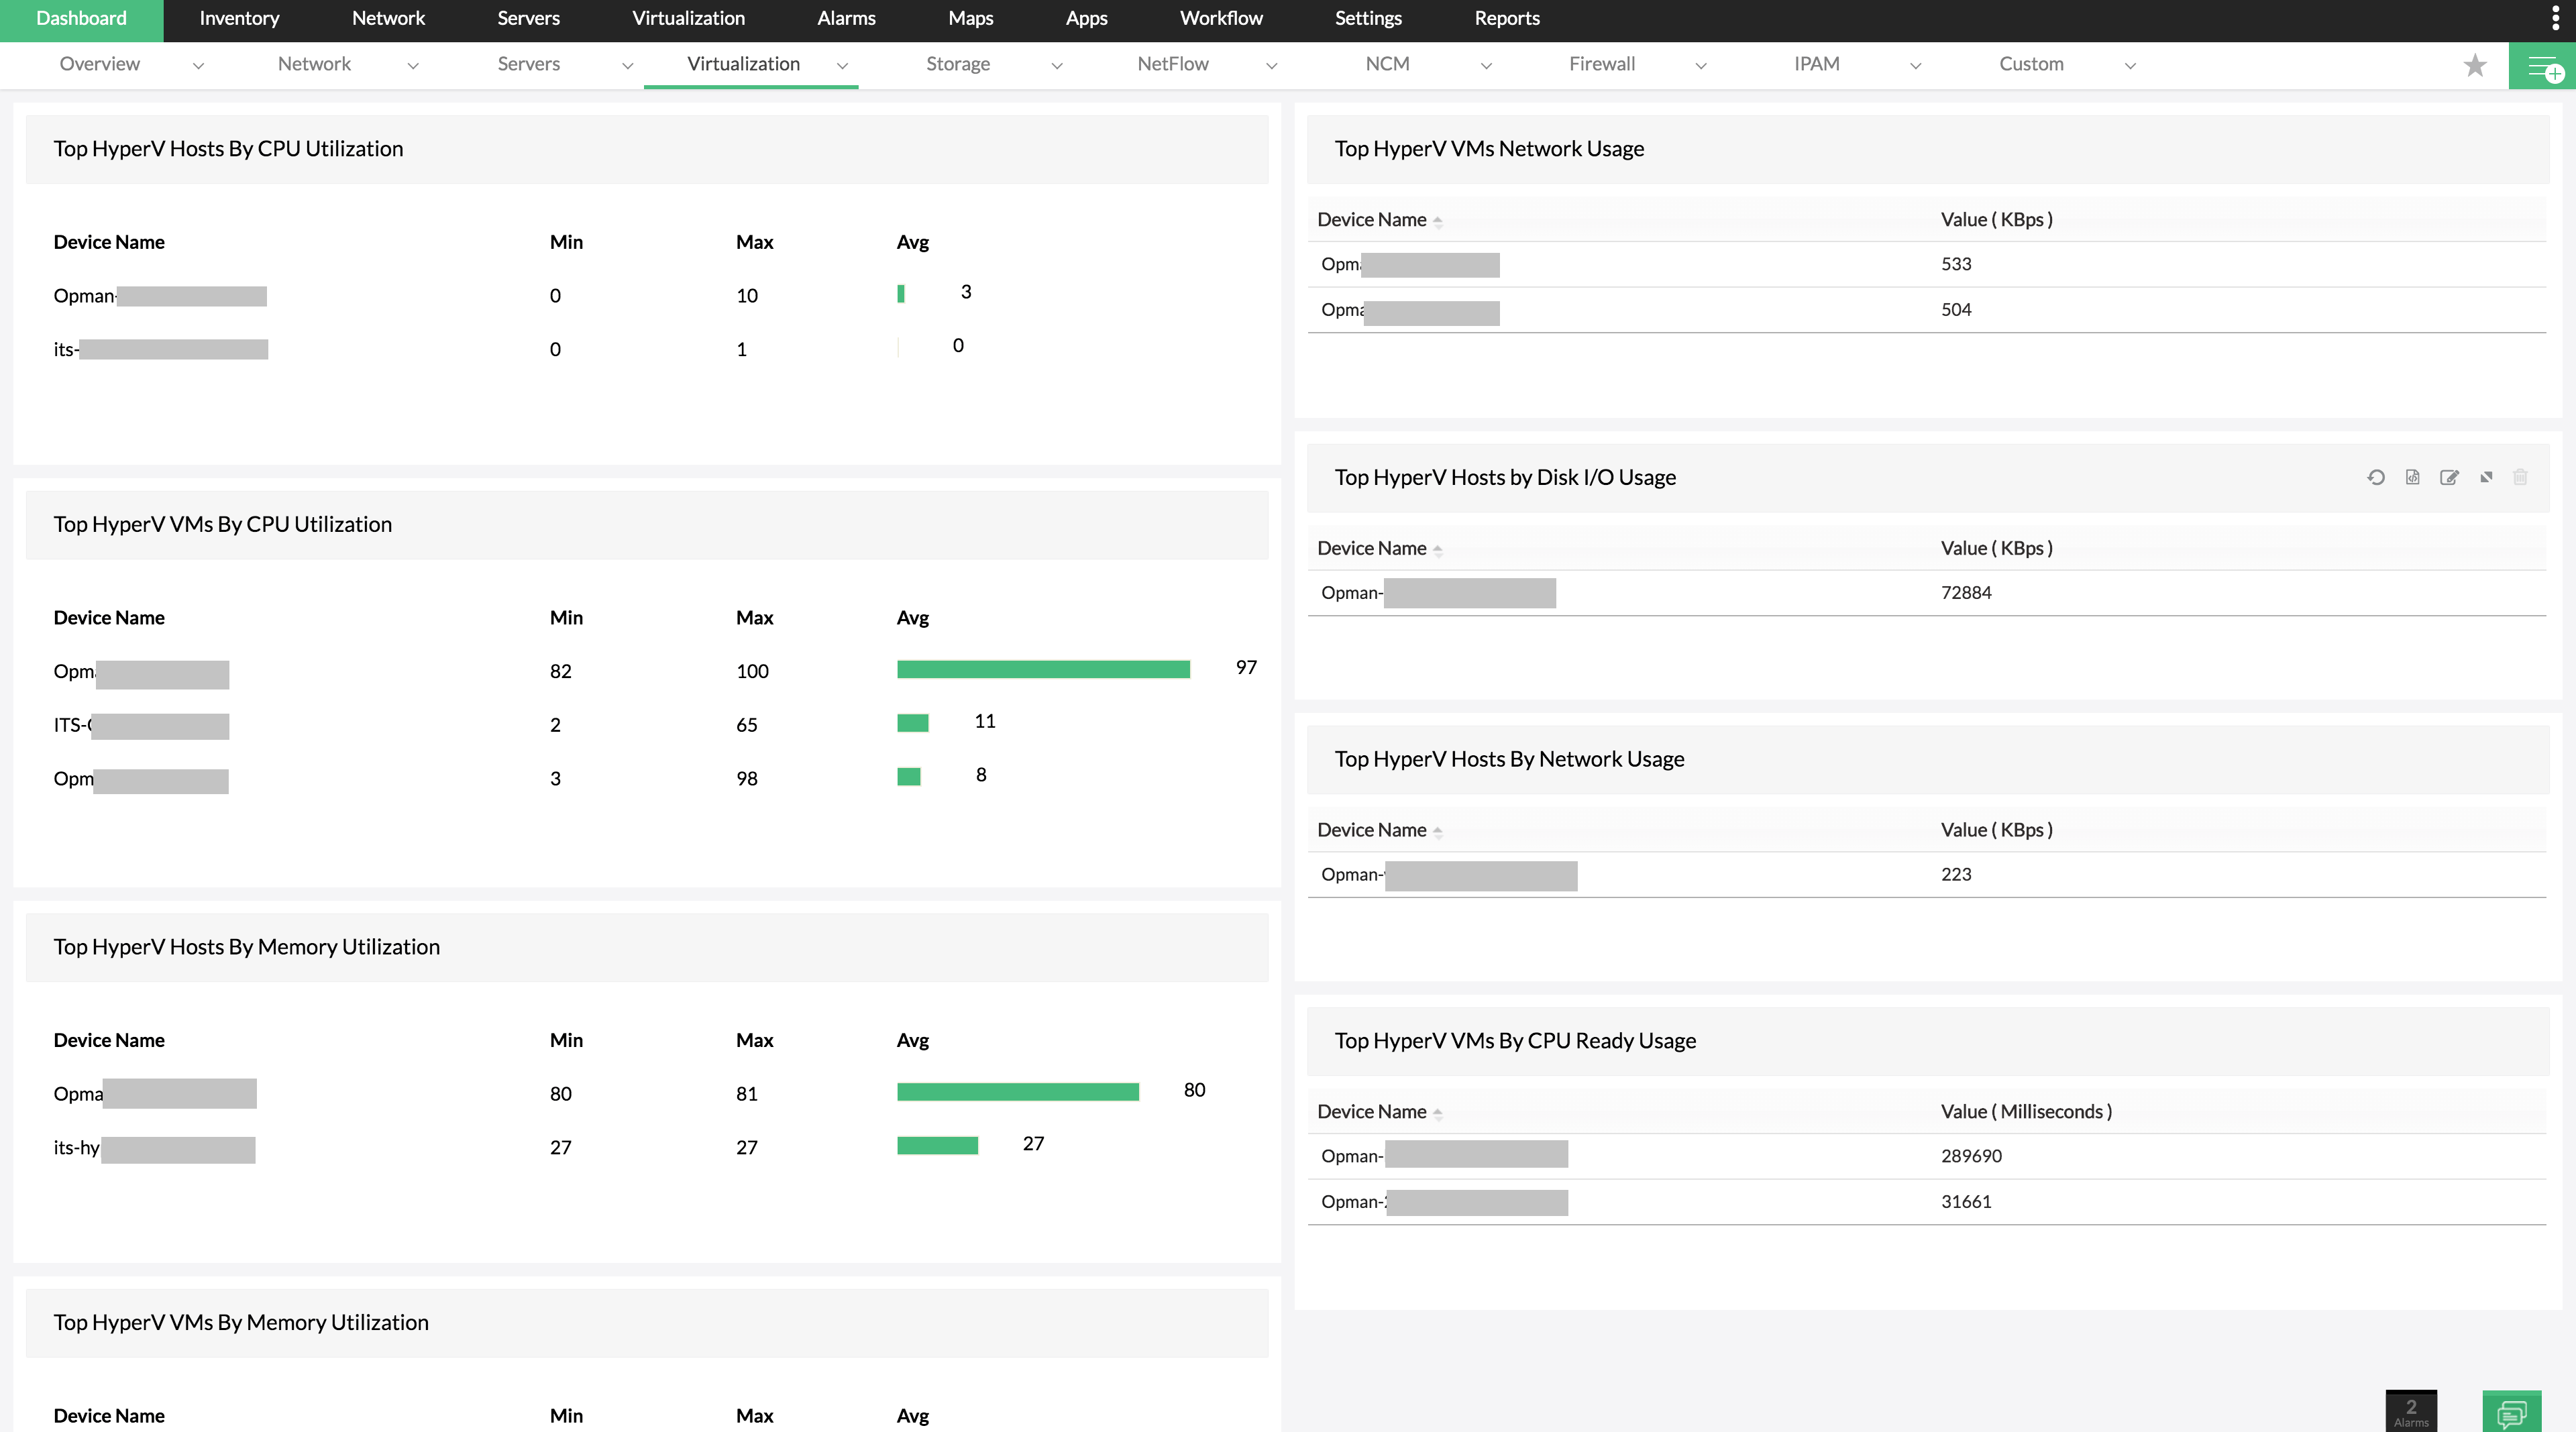
Dedicated dashboards: Monitor Hyper-V health and manage VM sprawl from a single console
Some large enterprise networks employ a huge number of virtual servers and have dedicated VM admins to take care of the virtual infrastructure in their network. In cases like these, performance metrics on non-virtual network devices are irrelevant to the VM admins, who instead want to constantly monitor the health of the Hyper-V network.
With OpManager's Hyper-V performance monitoring feature , you can easily monitor your virtual devices in real time using our dedicated dashboards. By default, OpManager has a built-in dashboard for Hyper-V devices, and you can easily monitor all vital performance metrics from a single screen. There is even a dedicated VM Sprawl dashboard that lets you know what resources in your virtual infrastructure can be reallocated so the Hyper-V network can function more efficiently.
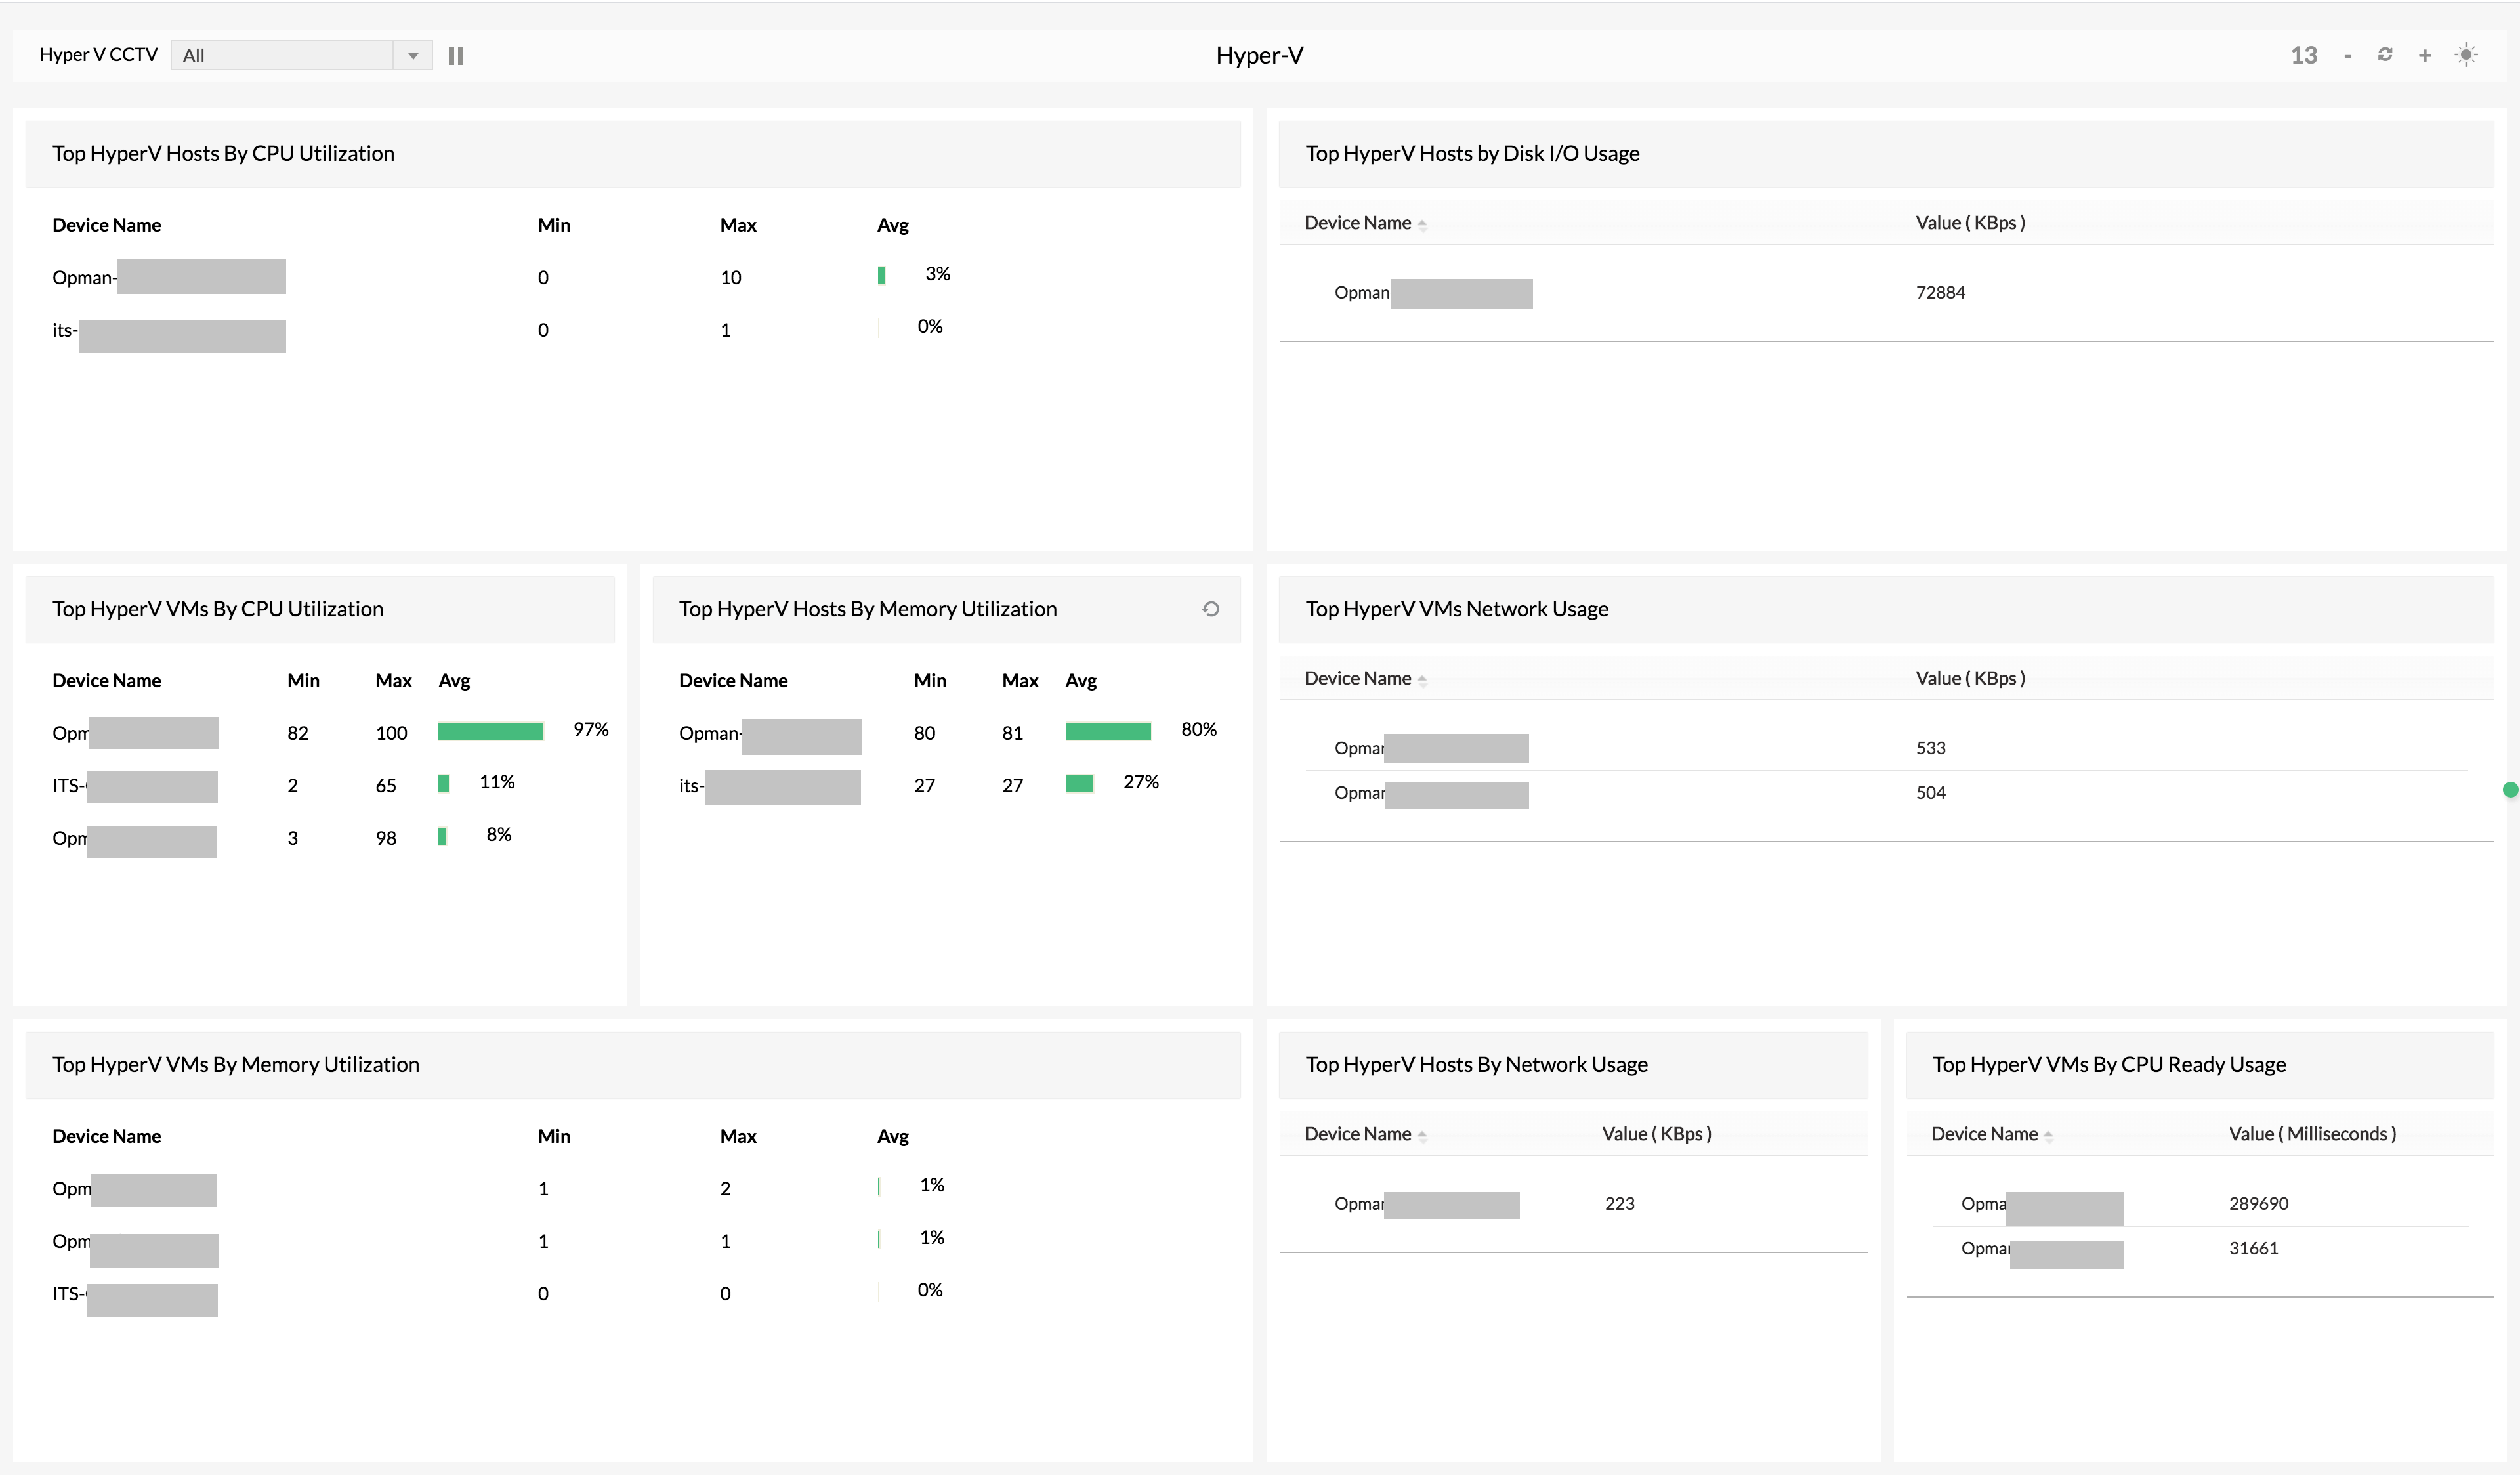
To ensure that you can view the latest data, CCTV views can also be created. The widgets present in the CCTV view can be updated based on an interval provided by the admin, which decides how often the data in all the widgets gets repopulated. This helps you stay updated on the status of your devices, and monitor Hyper-V performance in real time.
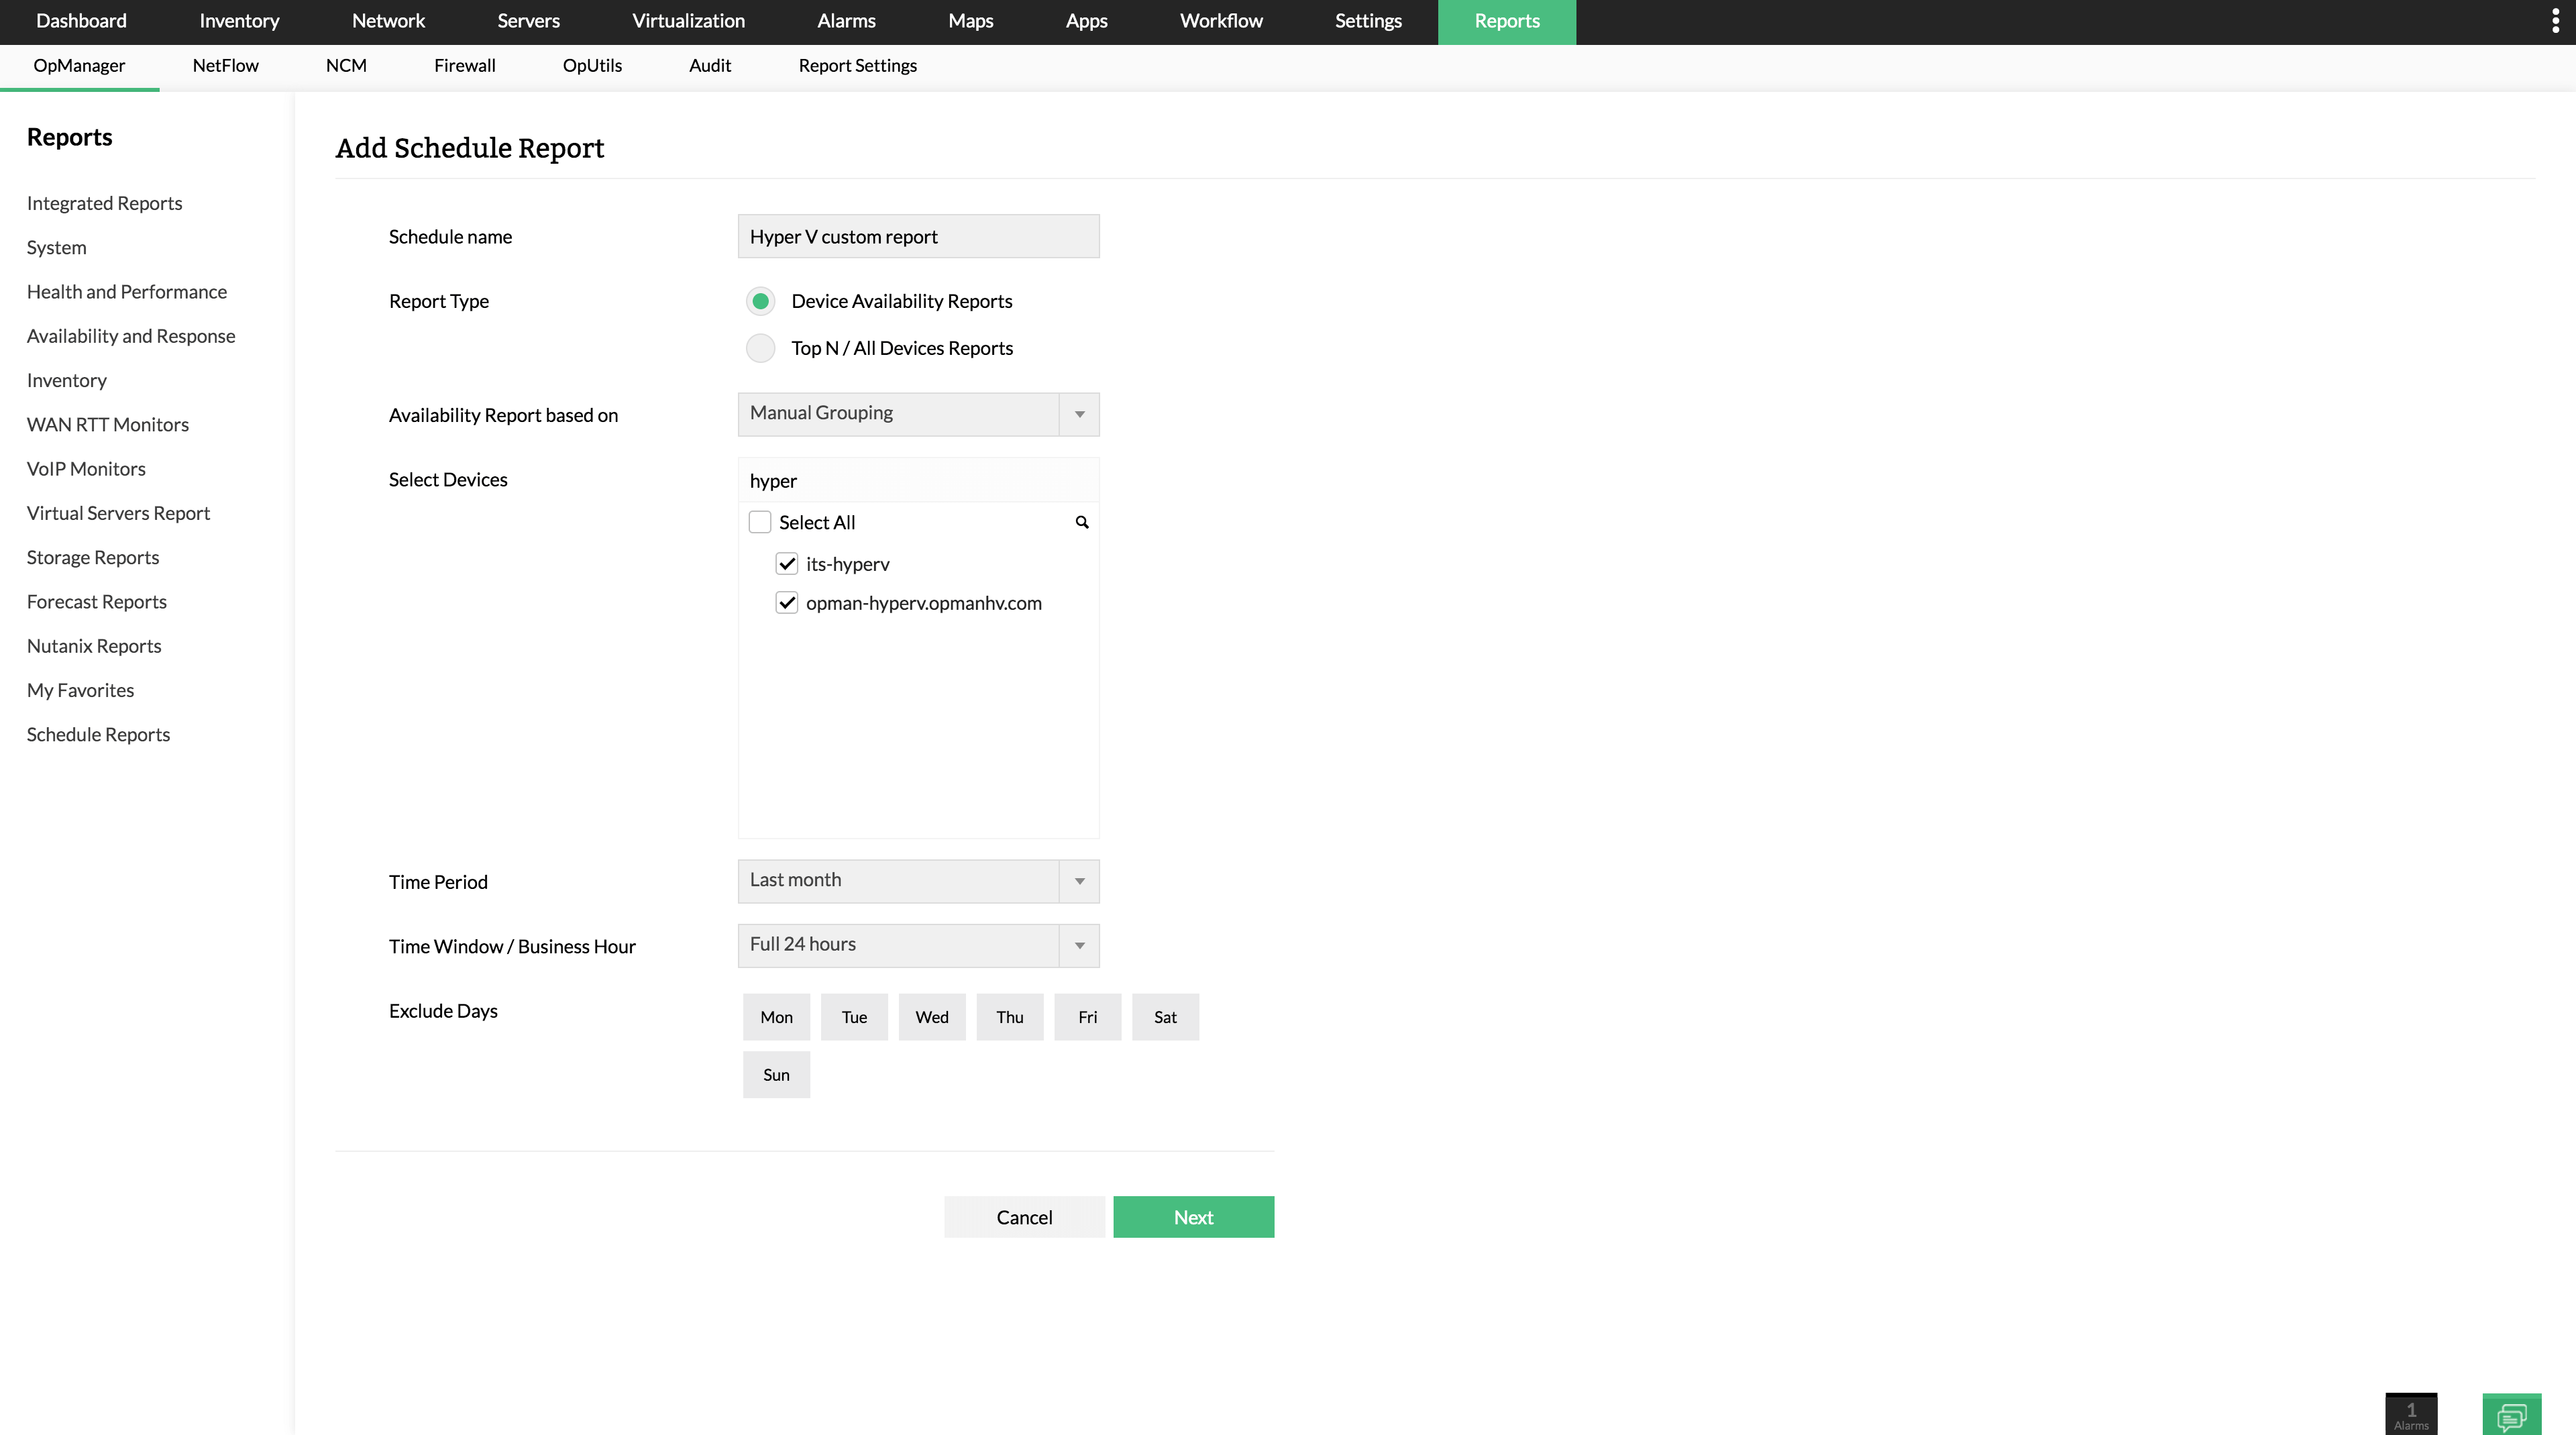
Advanced reports: Records historical data to aid effective Hyper-V resources planning
When network admin teams plan for maintenance or the upgrade of certain network resources or elements, they need reliable data to calculate their requirements and procure new resources accordingly. With only recent data available, they might miss a growth or decline trend in the network's needs over longer periods of time, resulting in miscalculation of requirements and unnecessary costs for the organization.
To avoid this, OpManager's Hyper-V performance monitor stores historical data for longer periods of time than many other network monitoring solutions, allowing you to look deeper into the details of a network's performance and needs. On-demand reports enable you to access historical data for performance metrics from the Reports section, where you can select the metric and the time frame for which you want to analyze the necessary Hyper-V metric. Thanks to the in-depth Hyper-V performance monitoring , getting valuable insights on your Hyper-V infrastructure is easier than ever.
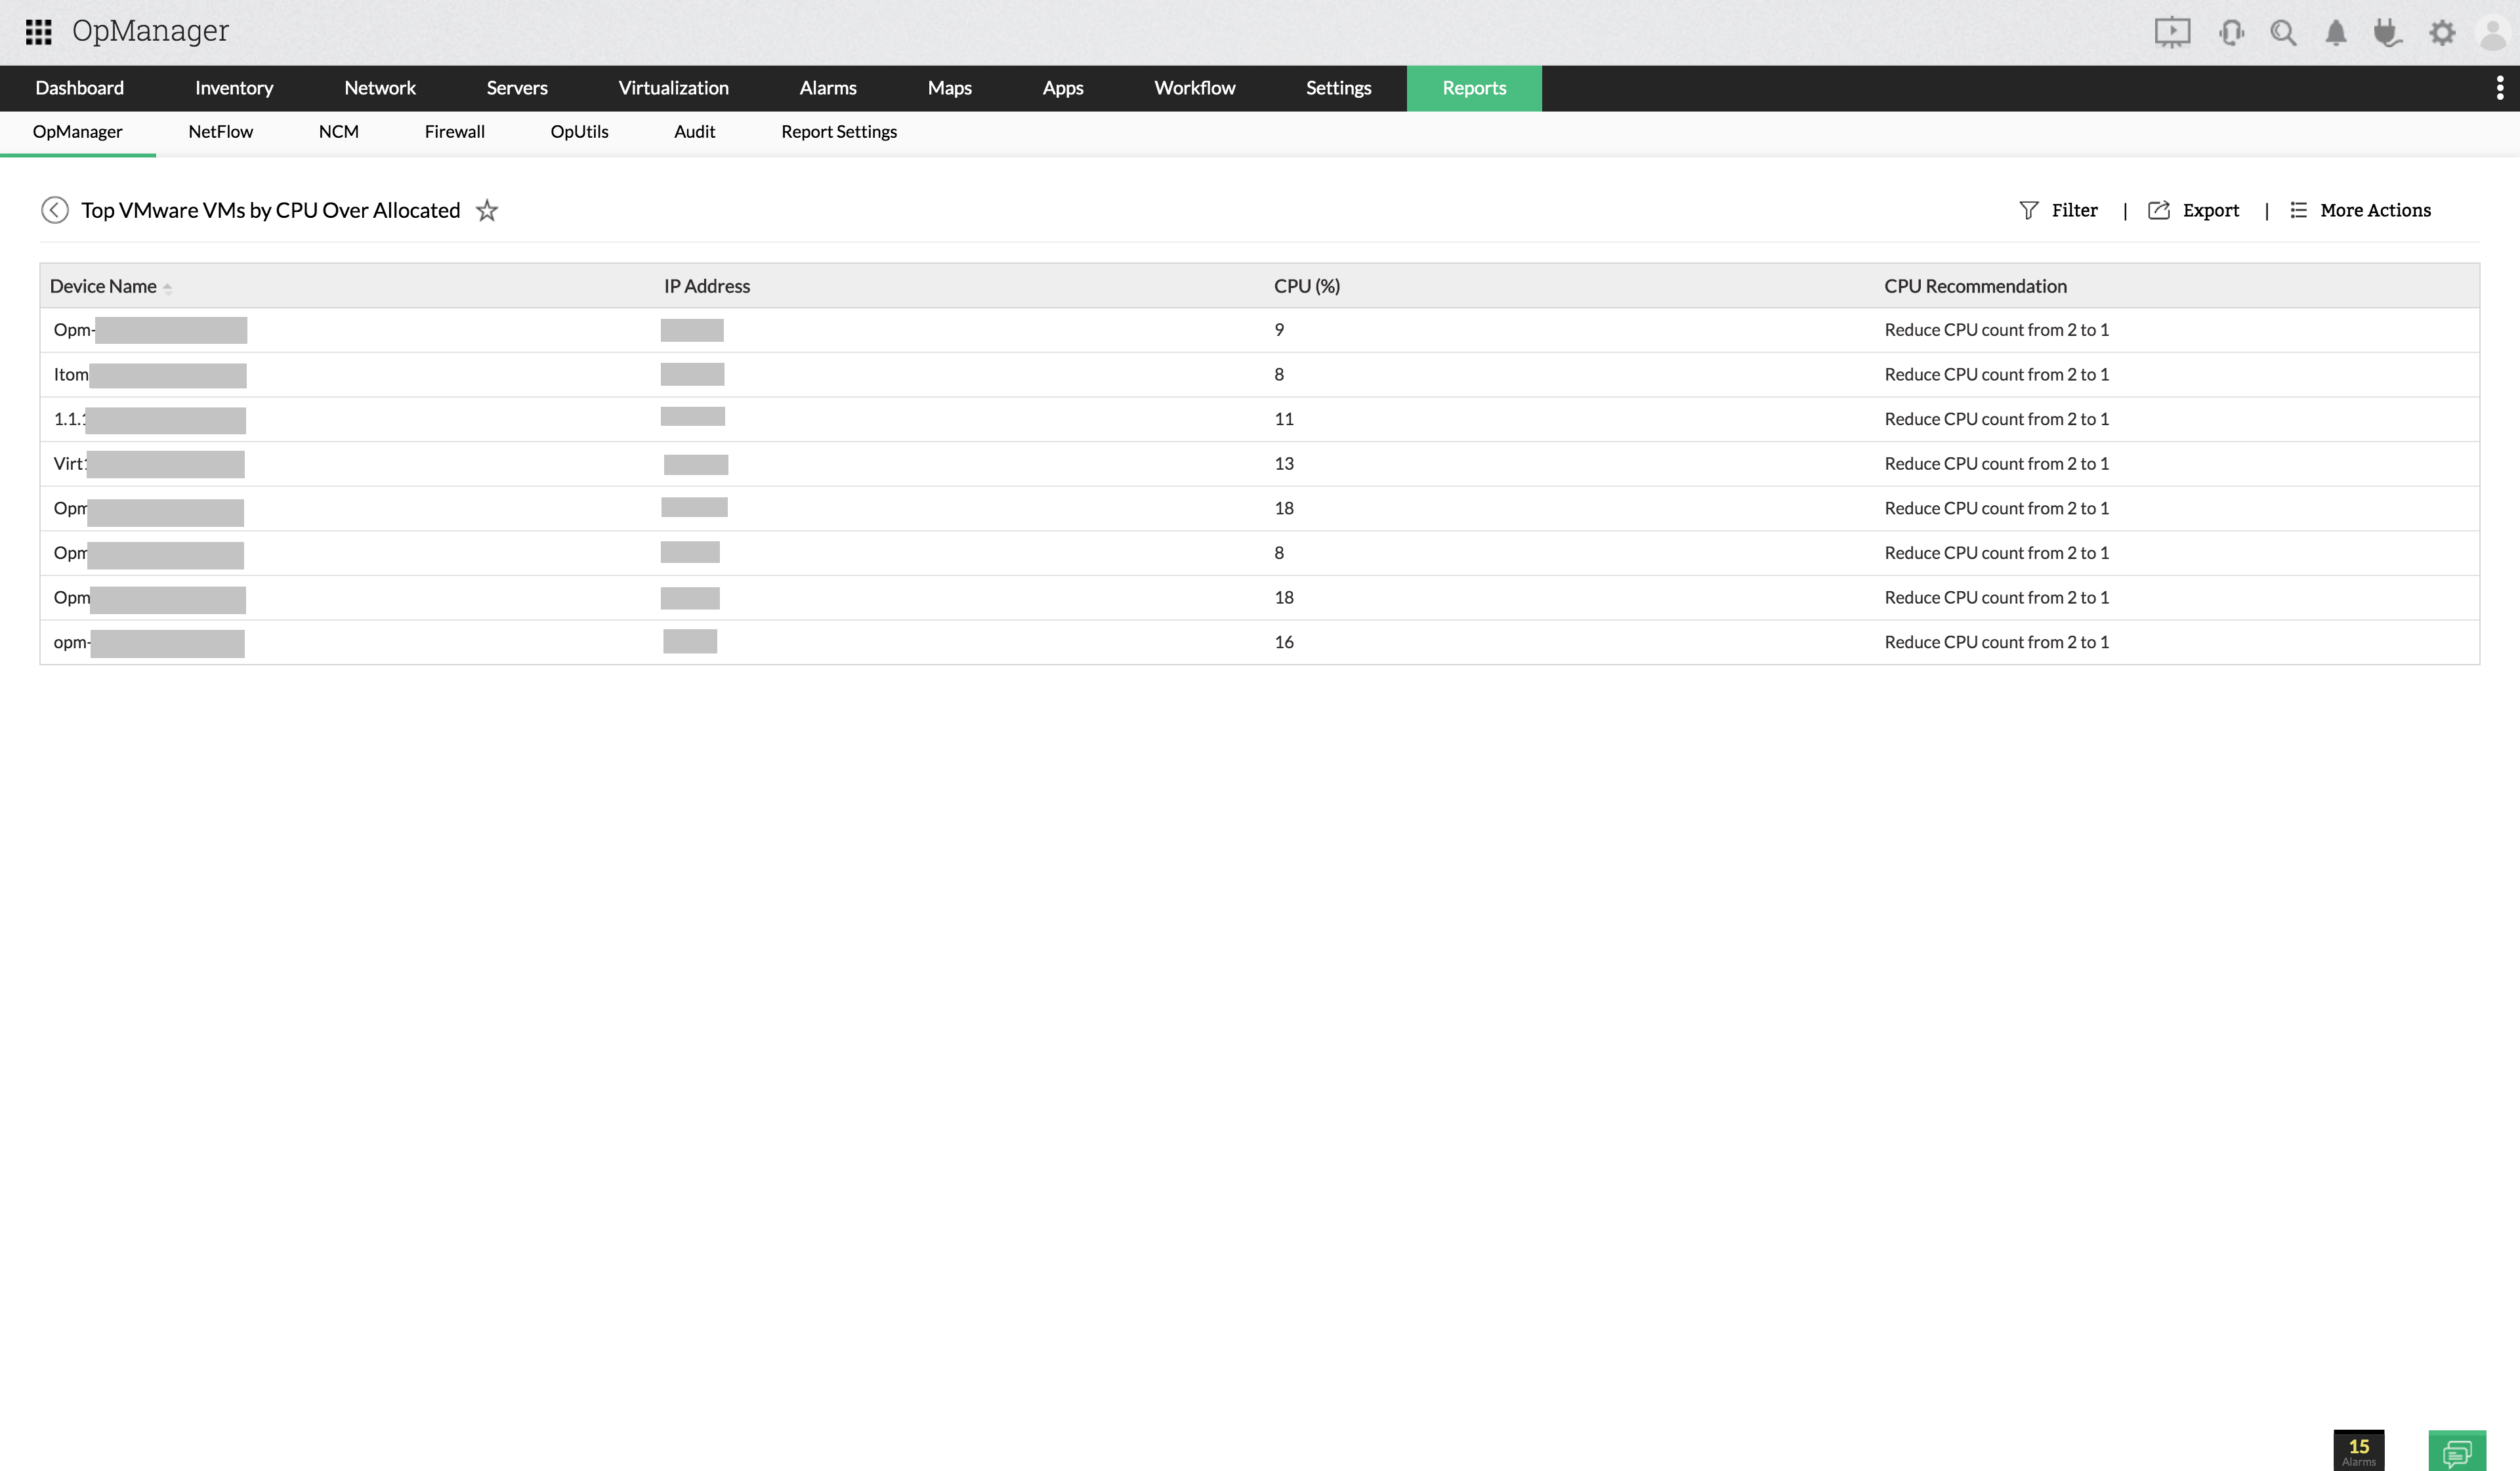
To make it easier, our Hyper-V performance monitor lets you export the displayed report into a PDF or Excel file, or even schedule it to be sent to you in a particular interval so you can keep track of your Hyper-V performance metrics even when you are not available at work.