Grouping network elements allows IT administrators to organize their IT infrastructure in a way that makes configuration management convenient for them. Network monitoring tools like OpManager monitors the performance and status of network elements. Monitoring devices with varied roles and functionalities from a single unorganized inventory can be a daunting task. With the grouping feature, IT admins can organize the IT inventory, classify devices, add relevant devices to groups and subgroups, and push configuration changes to specific network components en-masse.
OpManager has a powerful network grouping feature. You can easily add devices to the groups, associate actions to them, and monitor their performance as a whole. Here's how you can utilize OpManager's grouping network elements feature in your network.
A network element represents a particular component of a network that you wish to monitor. This includes devices like servers, routers, switches, WLCs, WAN accelerators, firewalls as well as multiple interfaces for these devices. OpManager can group all kinds of network elements as per your preference and convenience.
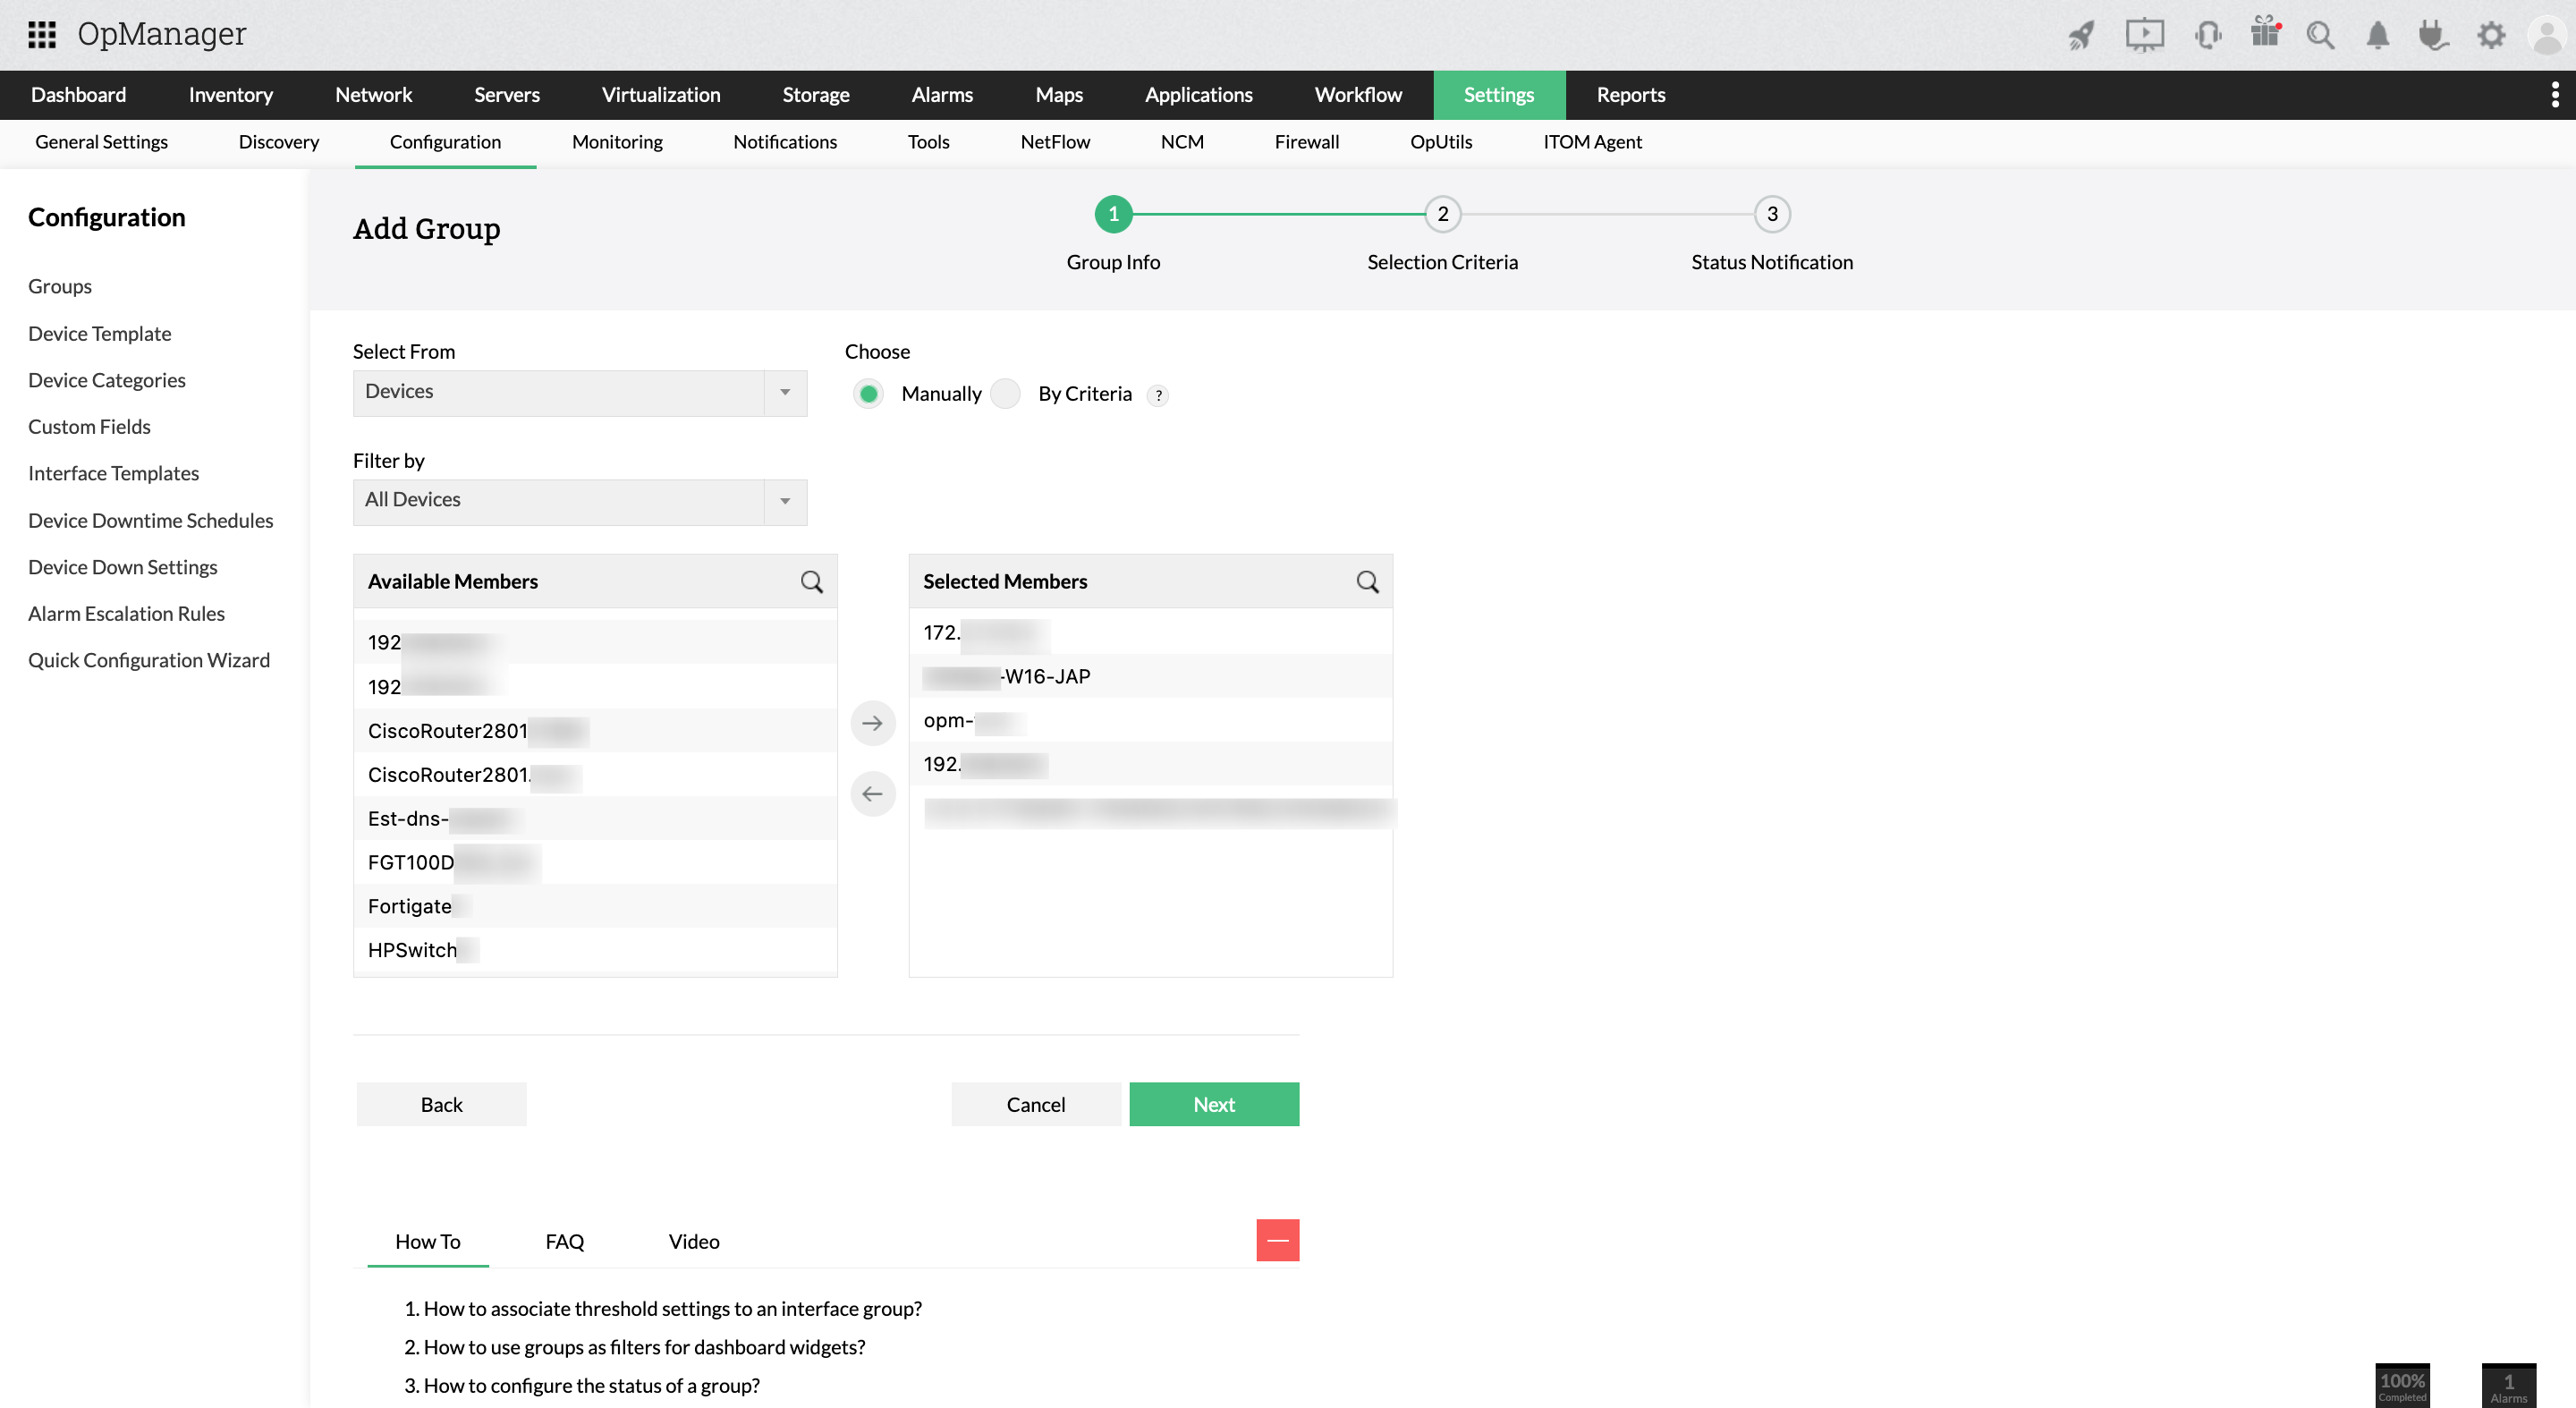
Manually: You can add devices or interfaces manually to group them. Devices are listed either with their IP addresses or their DNS names. Once groups are created, you can associate devices to them from the inventory list to add them. You can also edit group fields after creating them.
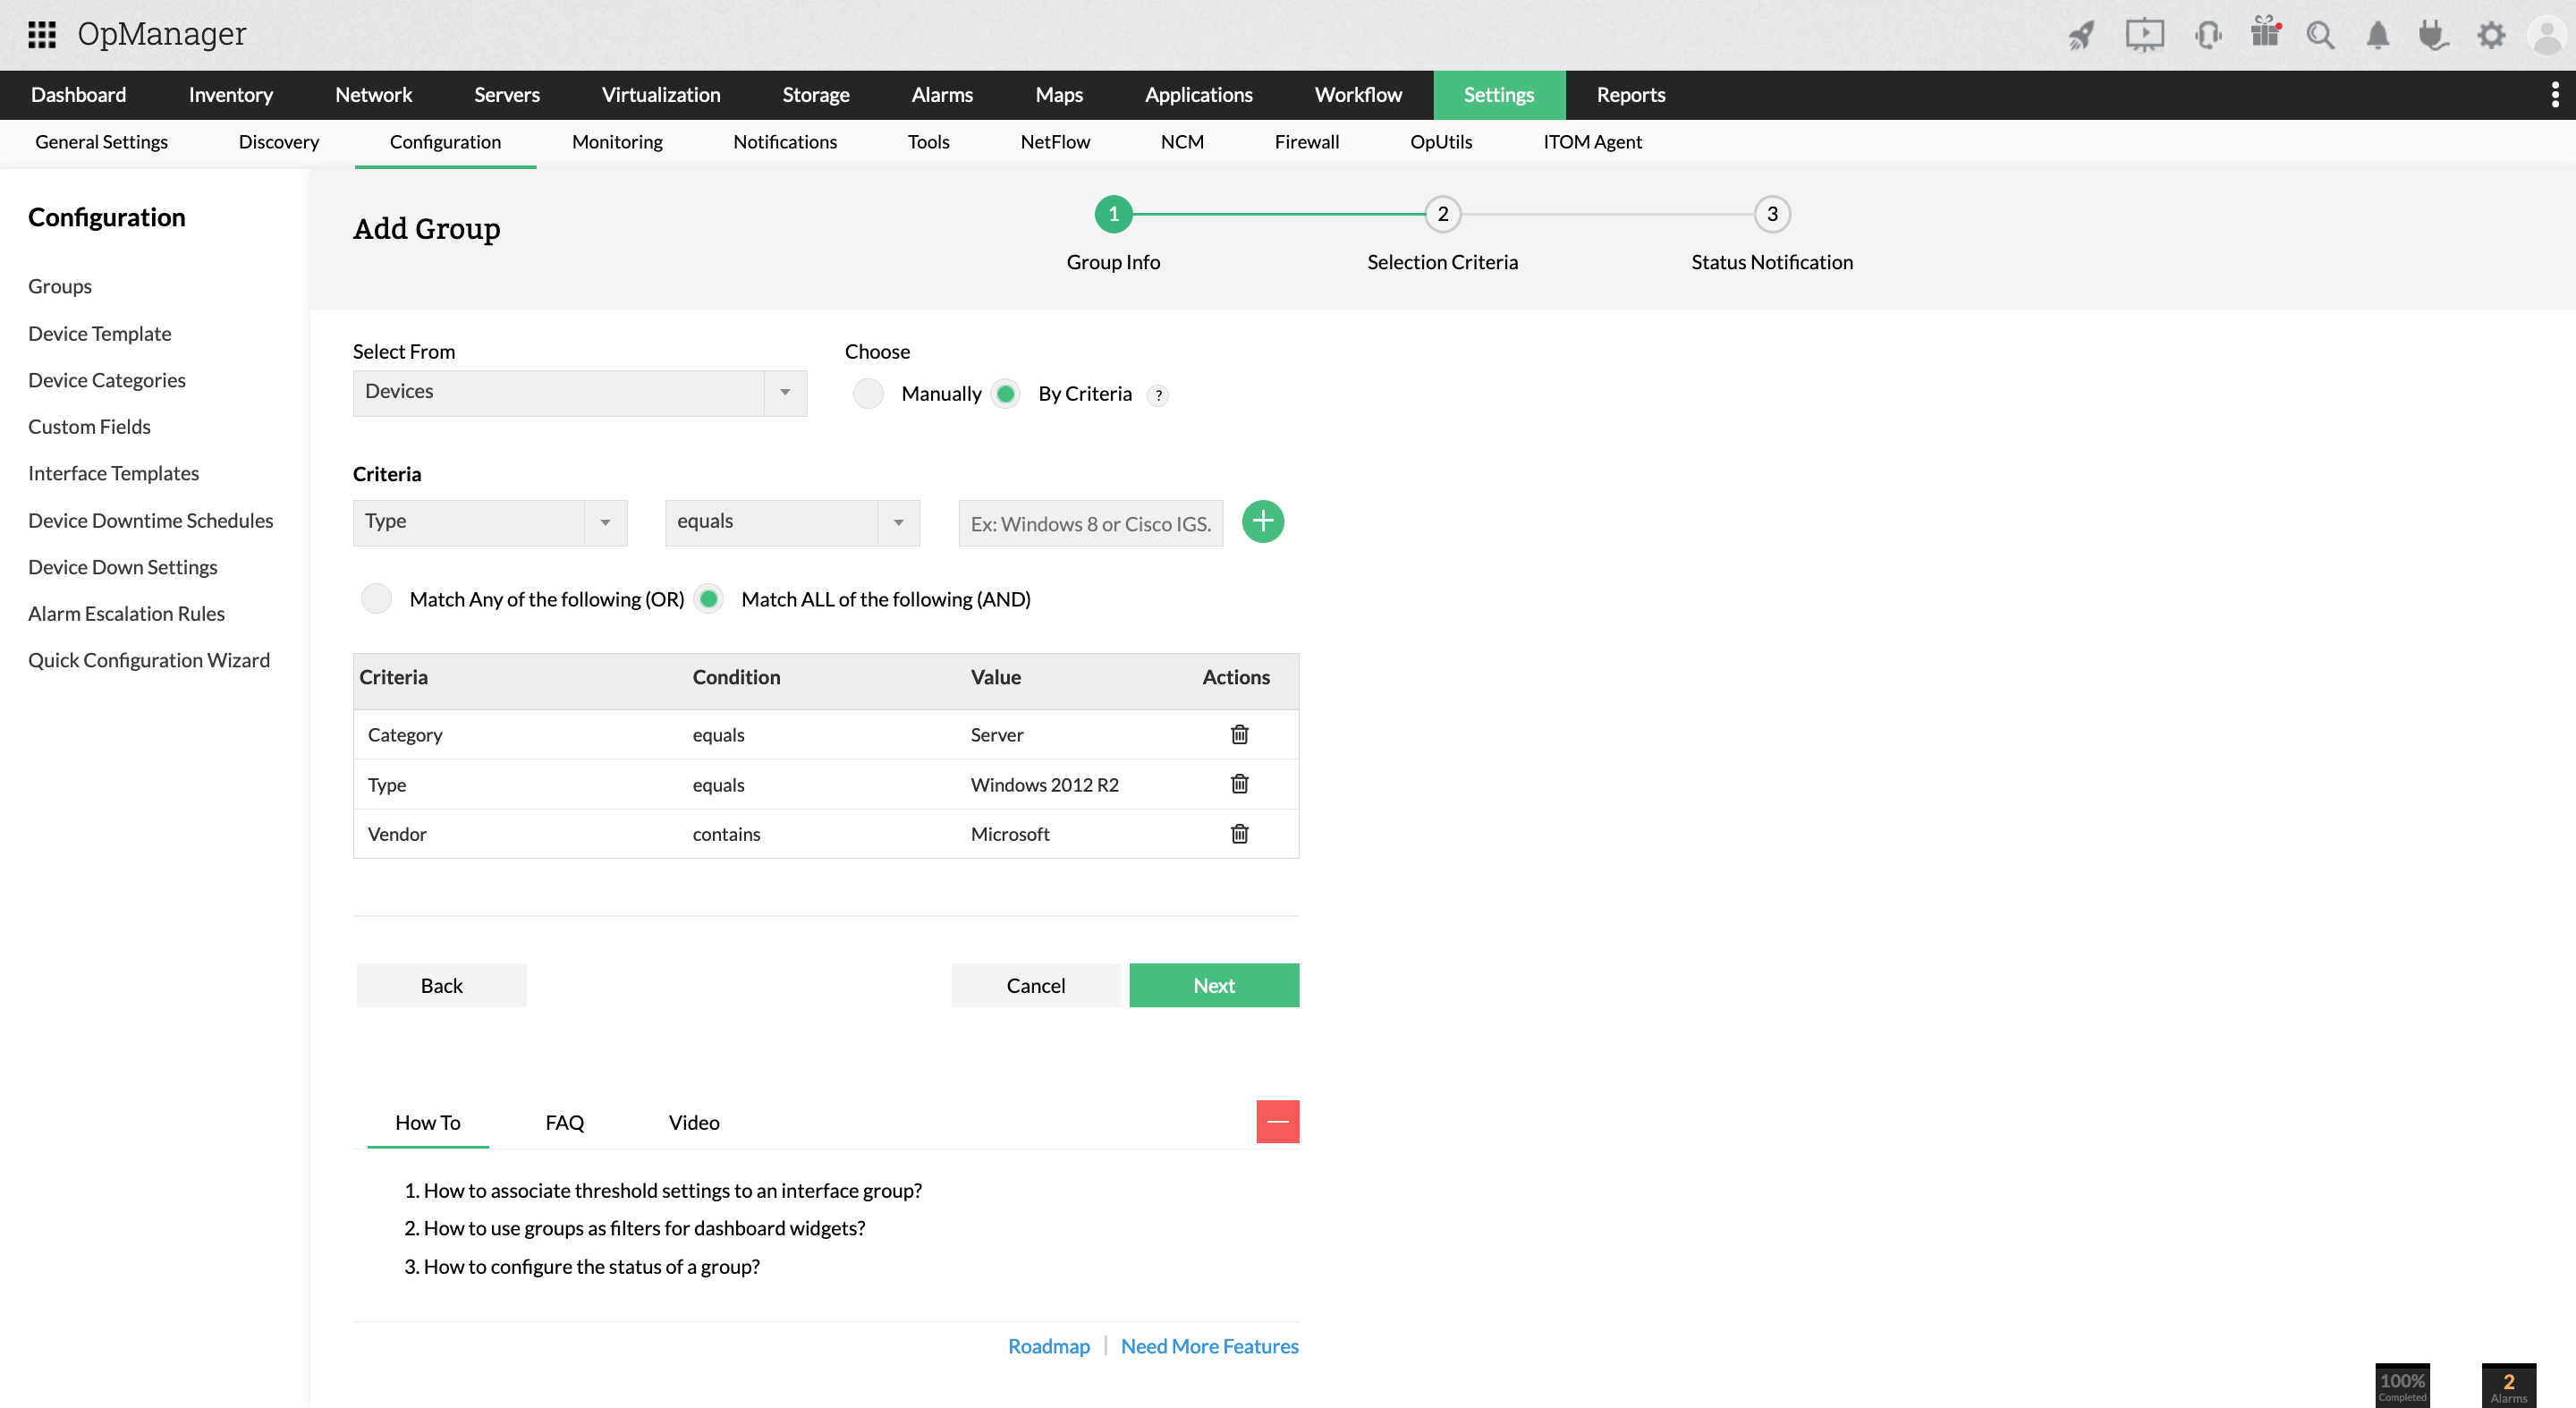
Using criteria: Another way of adding devices or interfaces or groups is using certain criteria. OpManager can either match all of the applied criteria, or any of them. Multiple criteria can be applied to select the required devices. Criteria for devices include- type, vendor, category, DNS, IP address etc. For interfaces, criteria like name, type, speed etc can be used.
Subgroups and super groups: Pre-existing groups can be grouped to form a super group. This allows you to classify your infrastructure according to their location, functionality, and dependencies.
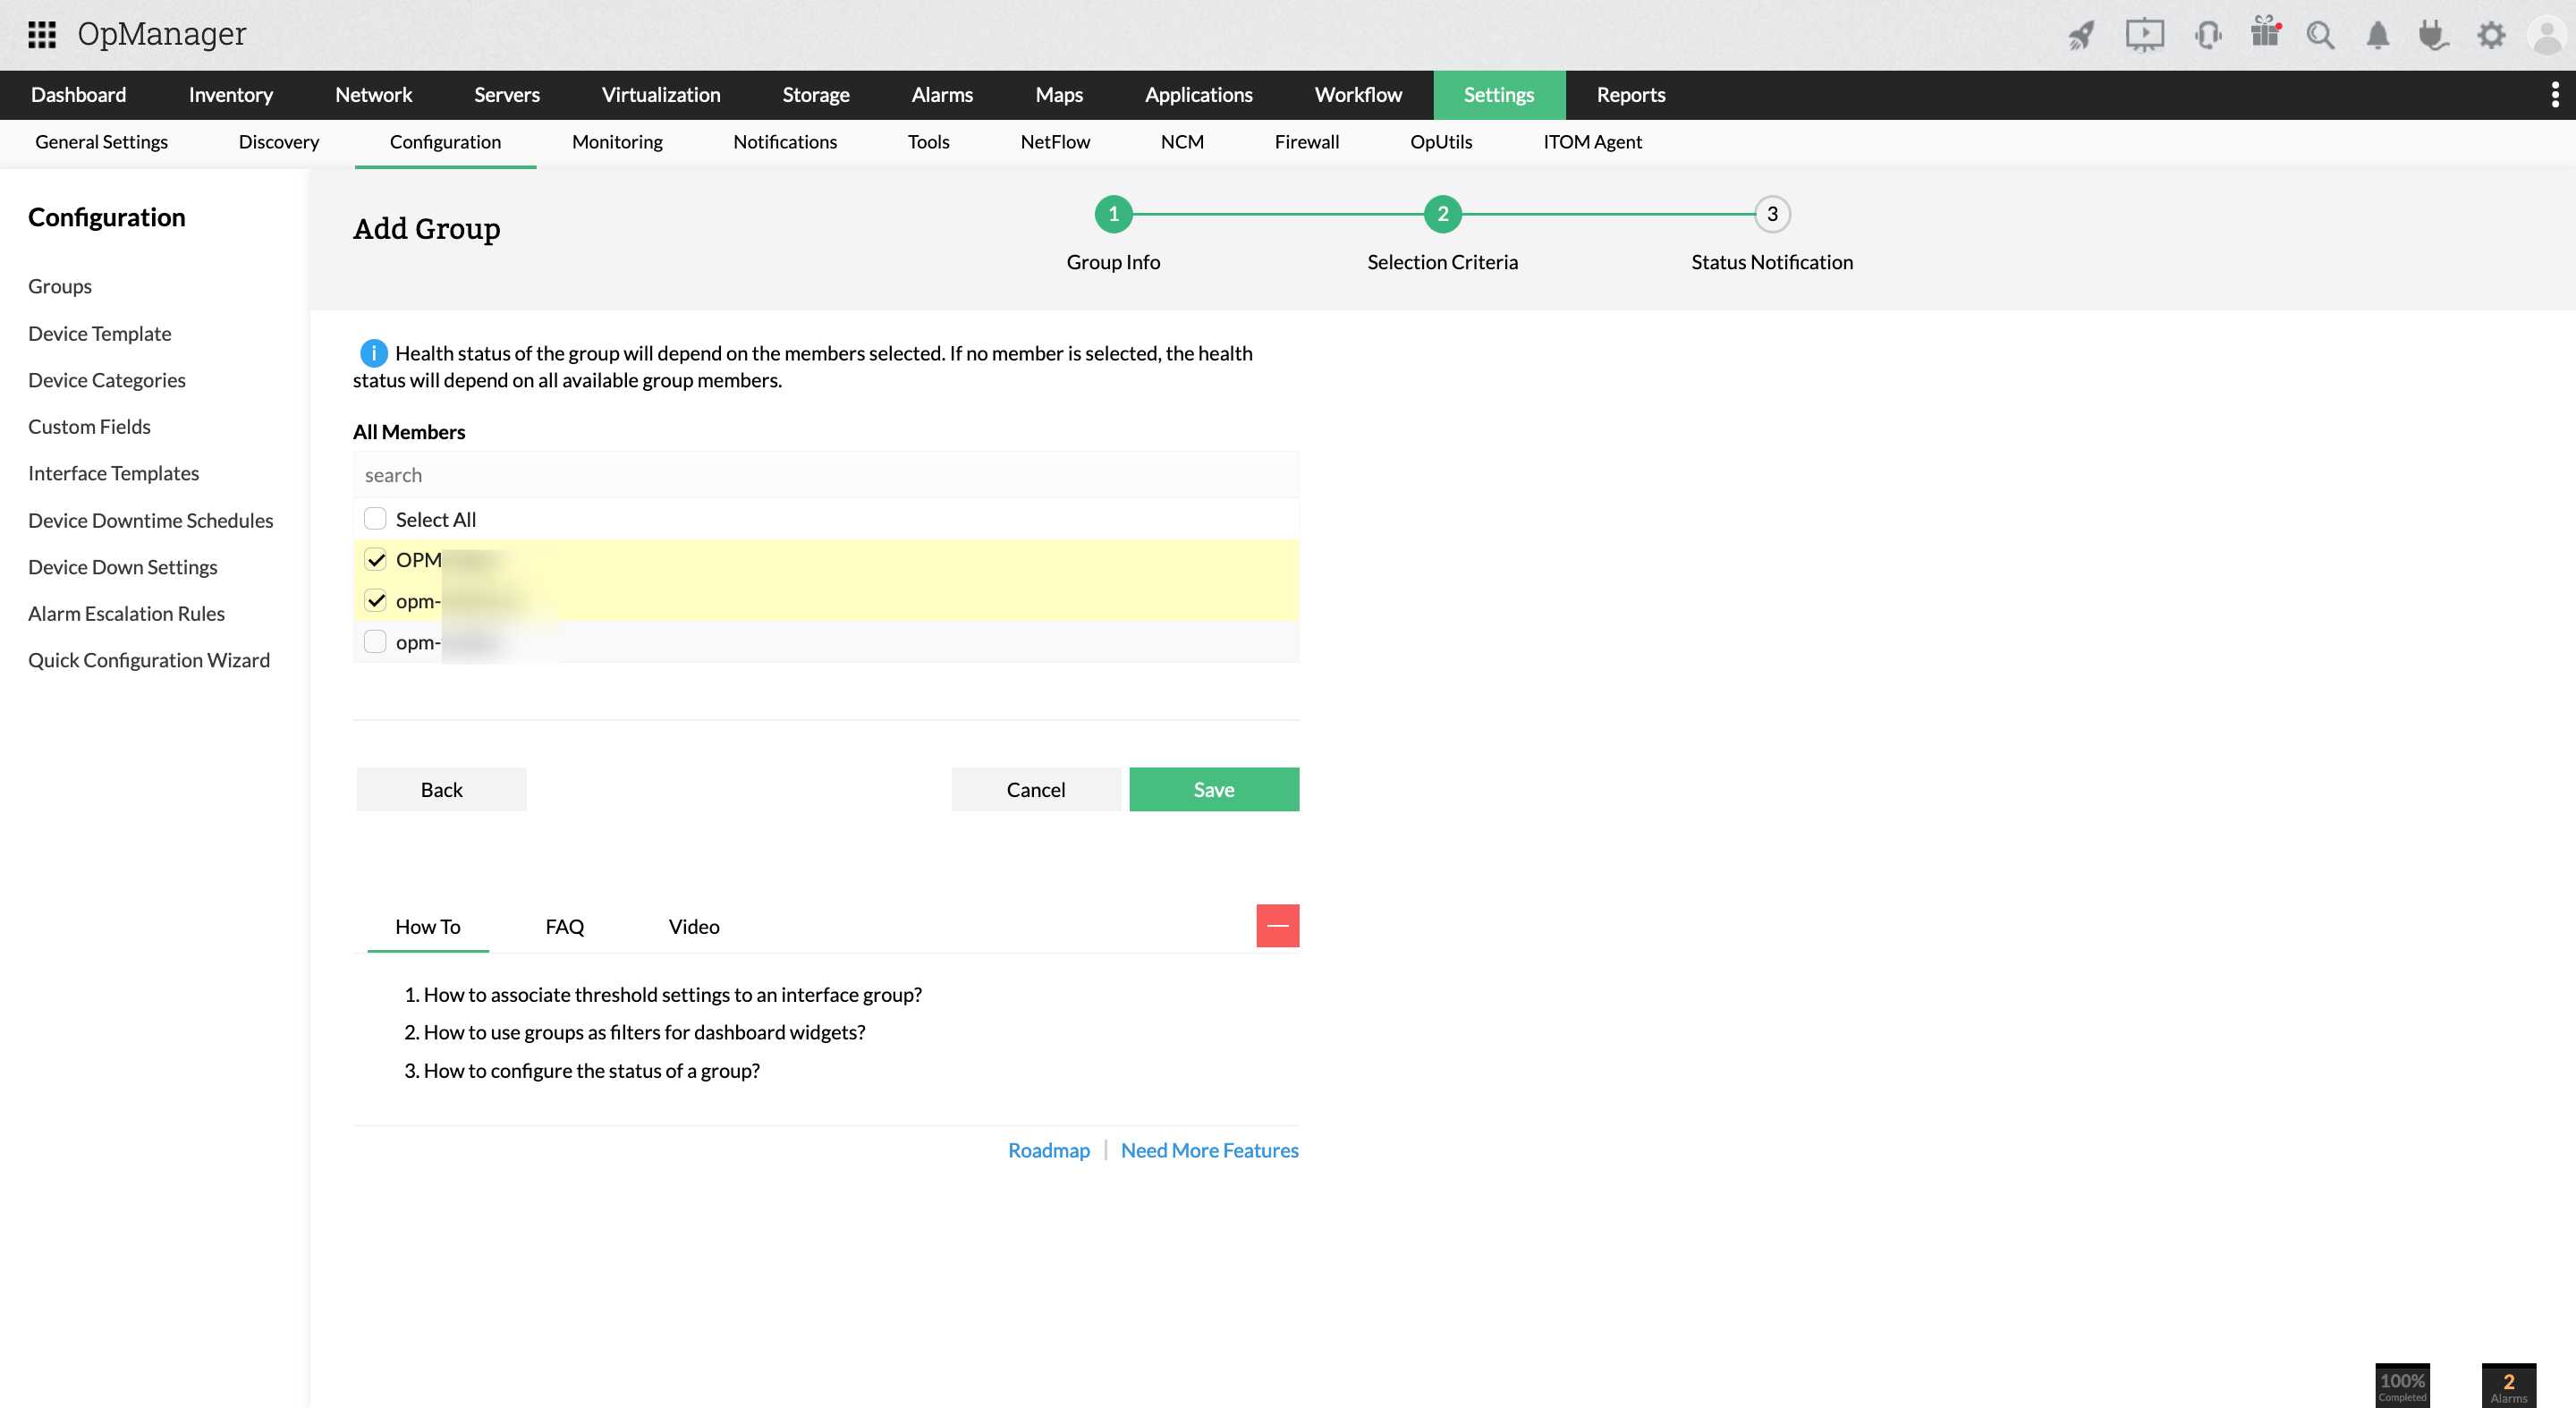
Group notifications: Group notifications can be configured to reflect the status of its specific components. This is helpful for services with critical devices. You can set the group to reflect the status of that particular device so that when that device goes down- the entire group shows that status. If a particular device isn't selected, the group will show the status of all of its component elements.
IT environments are dynamic and often undergo changes frequently. This could be result of the organization scaling up, device being moved around, or periodic maintenance operations. OpManager has a rediscovery function which can scheduled to scan the network environment periodically. When OpManager discovers a device that falls under the criteria of a pre-existing group, that device will be added to the group automatically. To sum it up, your groups will update automatically depending on the devices in your network.
Another way groups can update is using custom fields. Custom fields are information about devices like location, building, department etc. When you create a group using custom fields, OpManager automatically adds or removed devices depending on custom fields. Groups will be automatically updated depending on their given custom fields.
Groups as a filter can be selected to apply a particular configuration change to the members of that group. This allows you to create and push configurations changes to a specific set of devices quickly. This is particularly helpful when the monitoring and alerting requirements for different sets of devices are different. Here are some configuration edits where you can use groups as a filter.
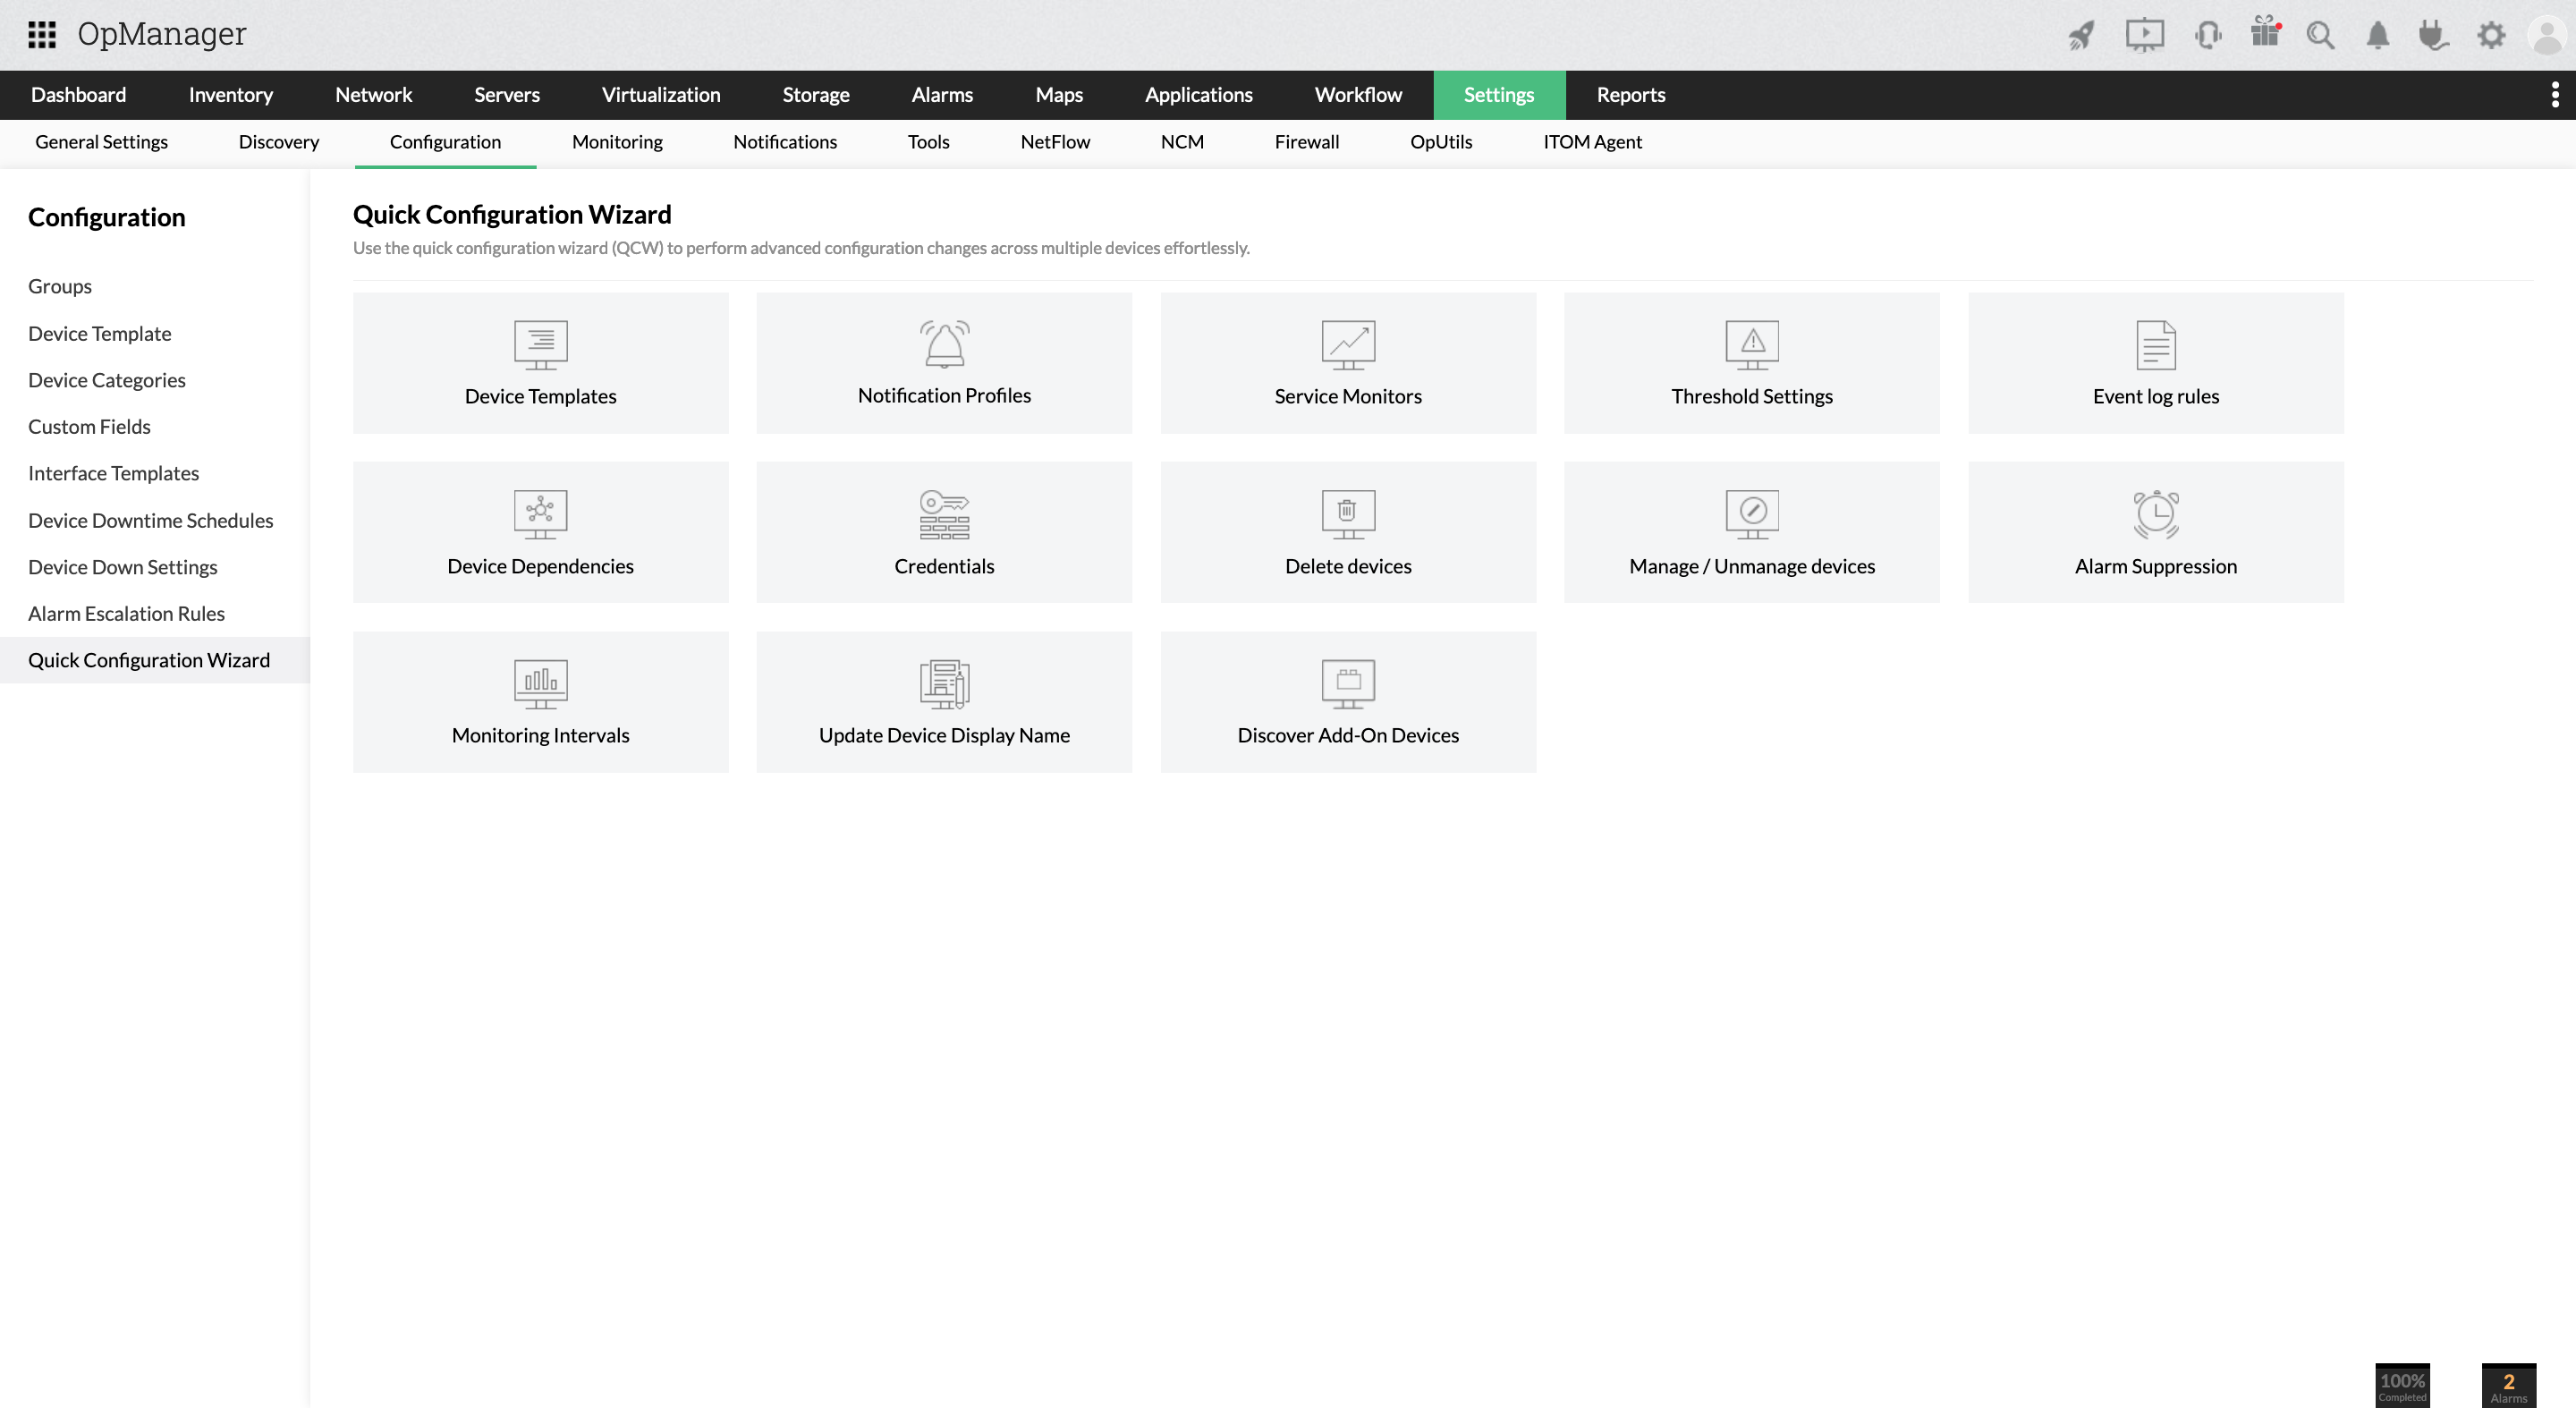
Interface Groups can be applied as a filter in:
In addition to organizing and classifying their IT inventories and pushing mass configuration changes, network administrators have another reason for grouping network elements: For better visibility into the network. Group availability distribution helps with that.
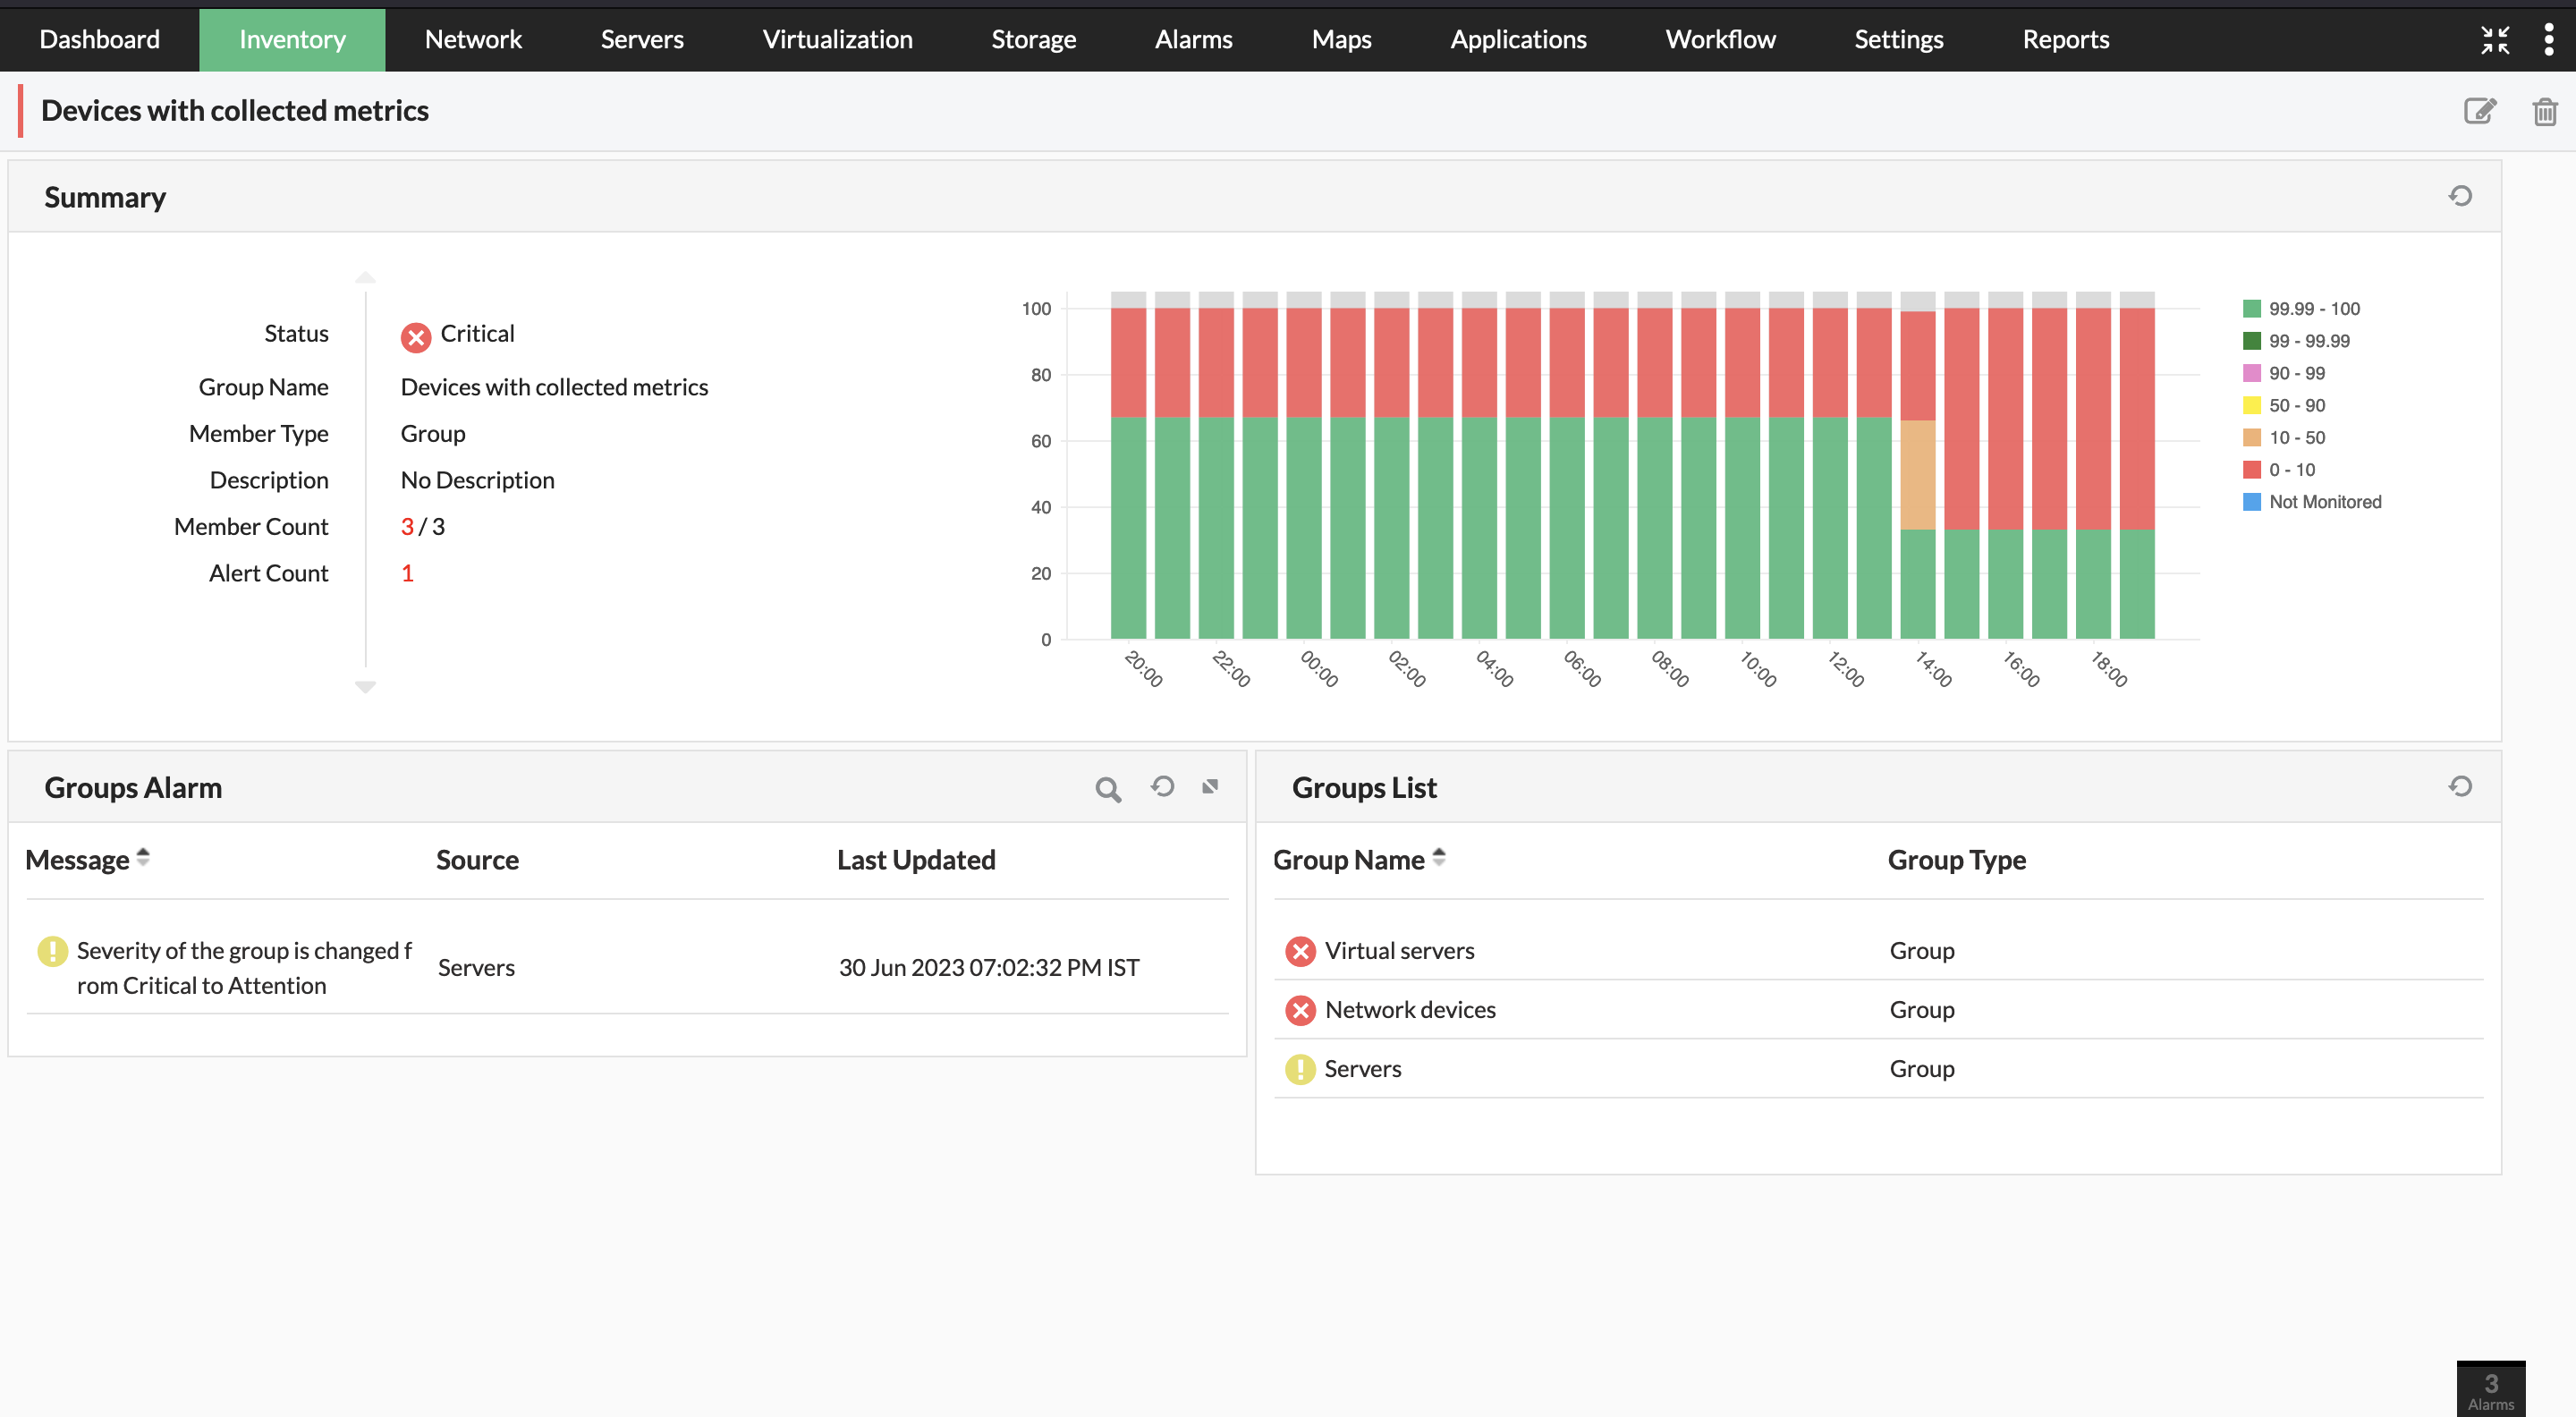
OpManager displays the availability of the network elements in a group using availability distribution graphs. The distribution graph has three fields: The percentage availability of the devices in the group- which is color coded, a timeline detailing availability at different times, and the fraction of devices with differing levels of availability. One glance at the distribution graph lets the admin know about the status of group and its components- facilitating better network visibility.
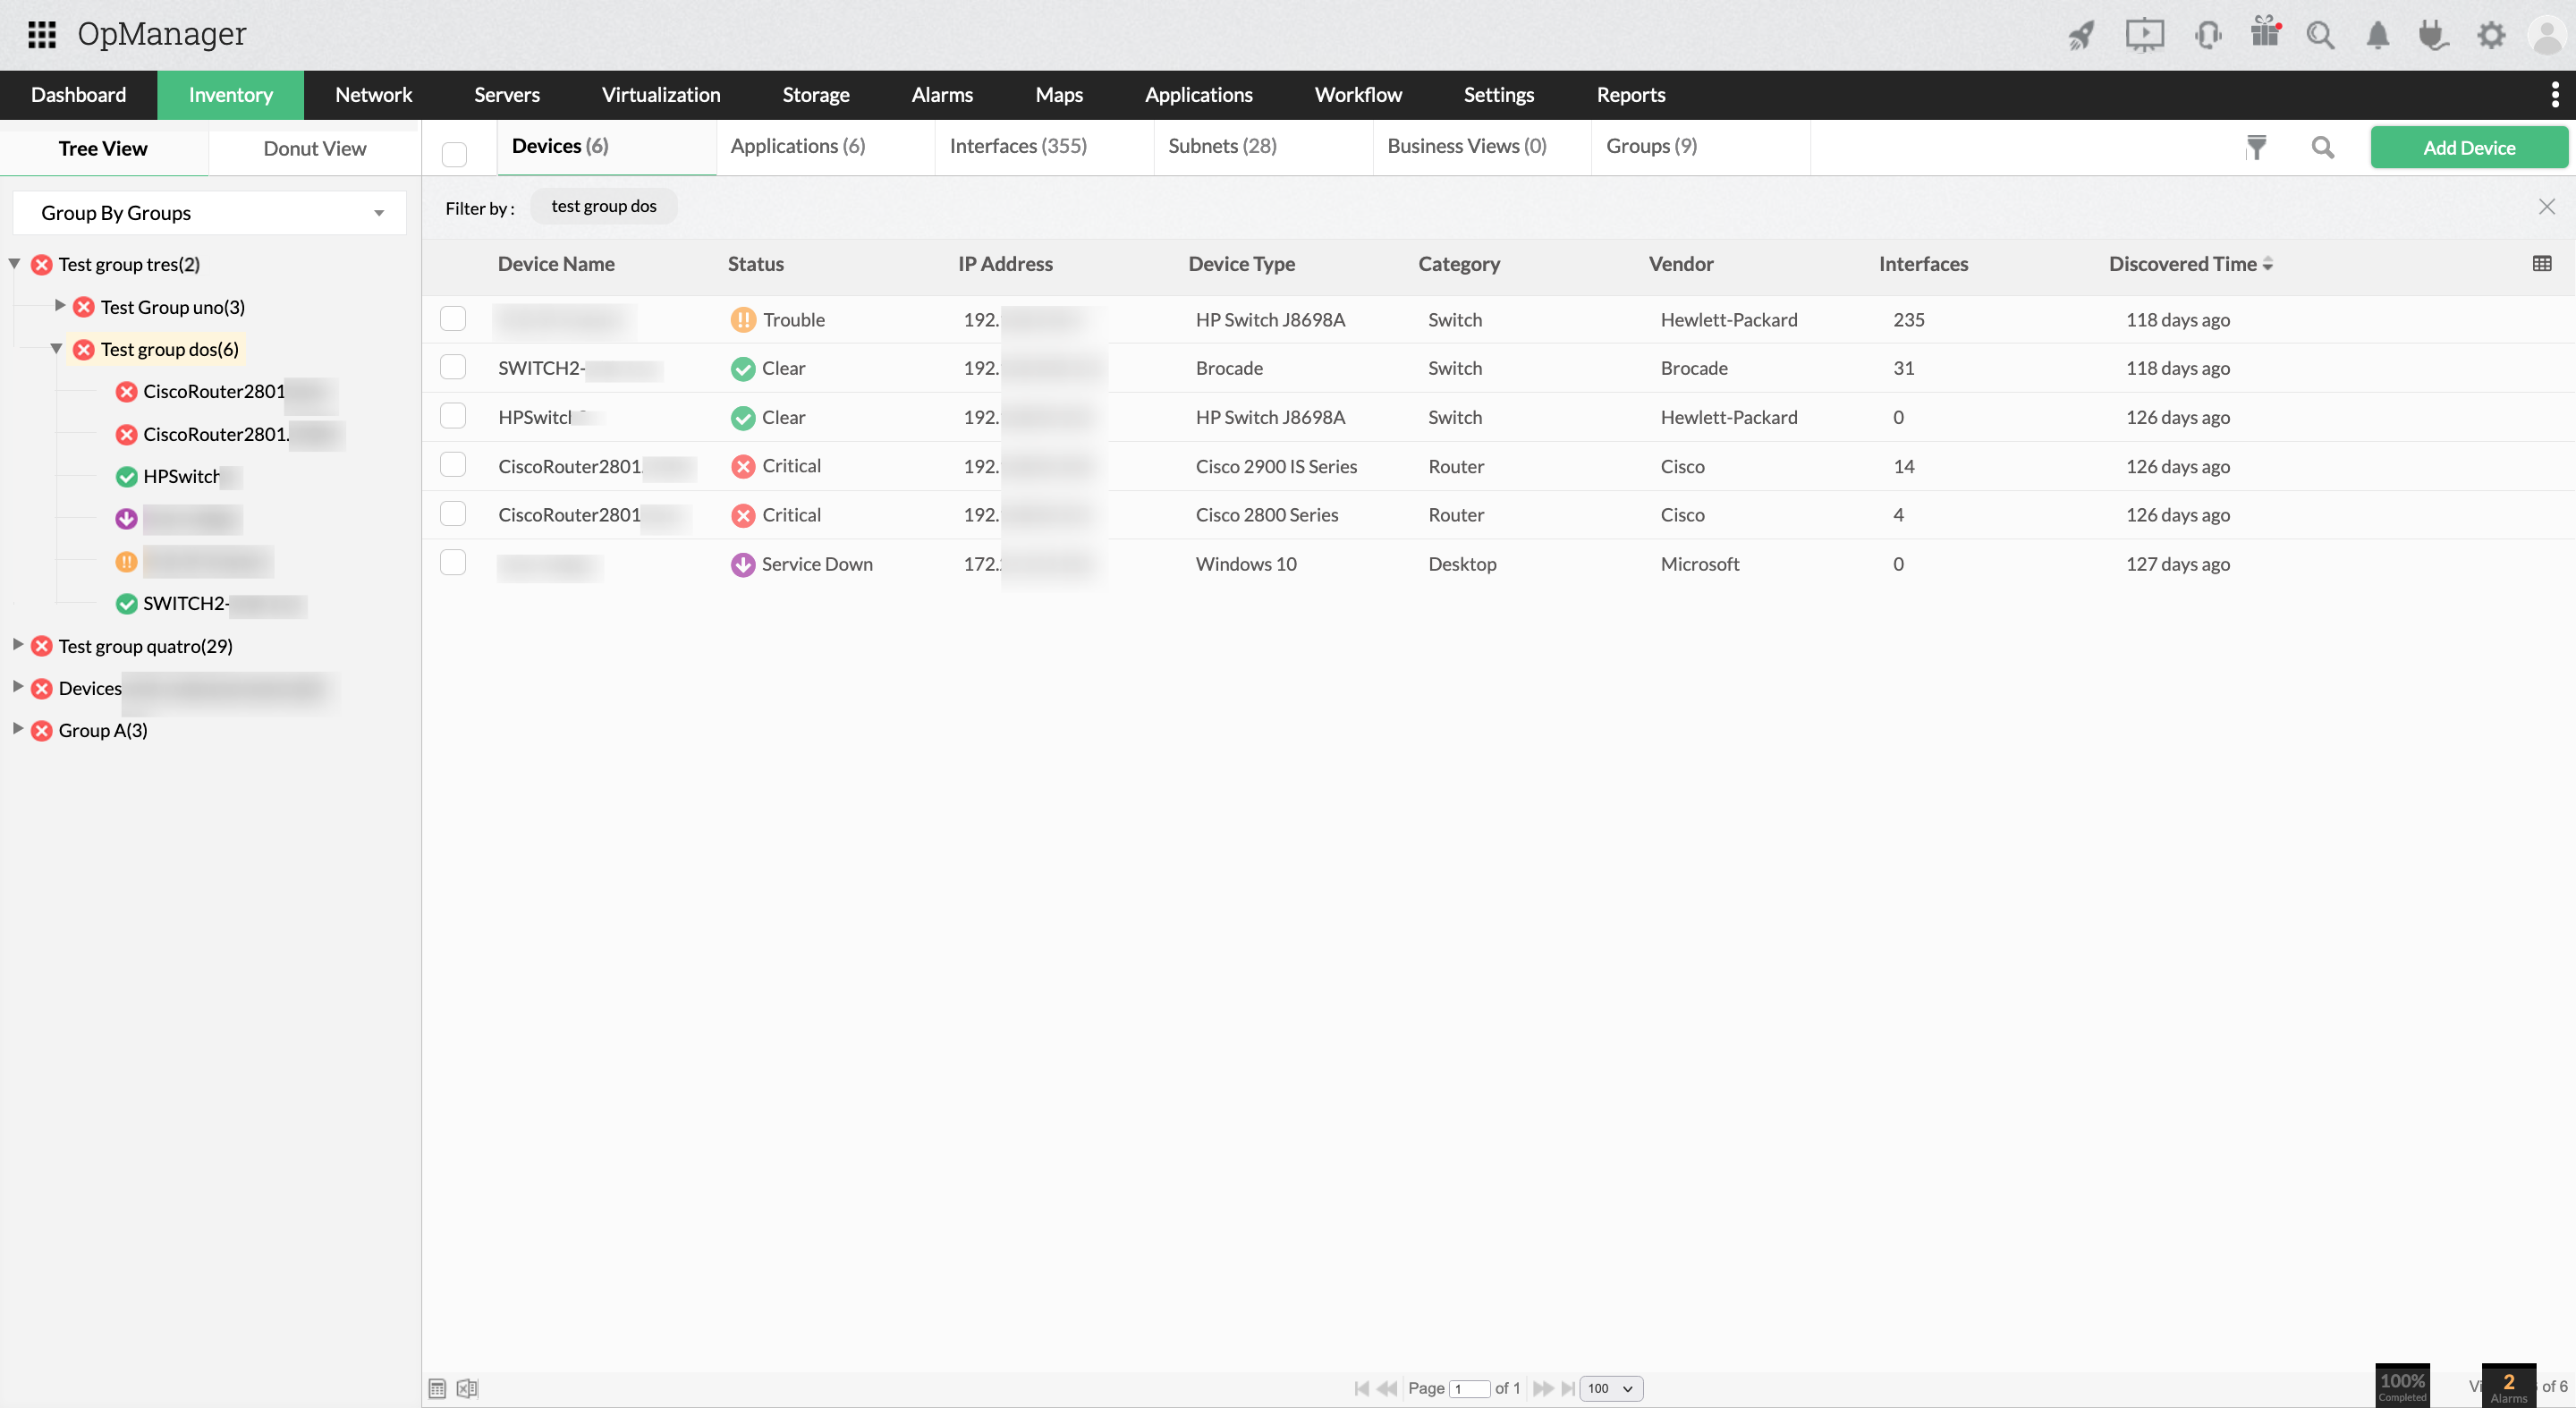
Group tree views allows you to view groups across your inventory in a hierarchical format. The super groups will be shown on top, and from there you can drill down into subgroups and devices or interfaces shown in the groups. Tree views list your inventory in a way that is convenient to navigate. The location of a device in a tree view is indicative of its function. With the super groups reflecting the status of its member groups and devices, you can easily find and locate defective devices.
Grouping network elements helps you maximize OpManager's convenience and tailor your monitoring requirements for devices and interfaces. Download OpManager today, or try our free 30 day trial to see for yourself!