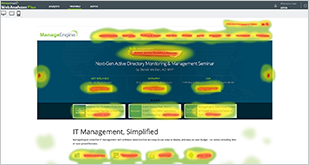
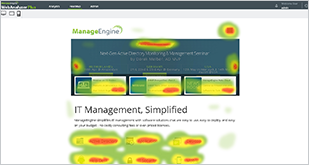
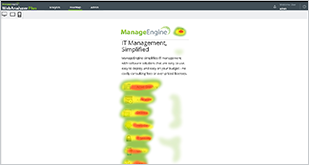
WebAnalyzer Plus can turn your webpage in to a heat map, so that you can see where visitors actually clicked on your website. Heat Map is a great way of visualizing how visitors to your website are interacting with its various elements. With this information you can analyze what’s working and what’s not, and strategically make necessary changes to your website to increase conversion. It’s pretty simple to enable heat maps for your website. Simply copy and paste the JavaScript code provided to you, and sit back and watch WebAnalyzer Plus weave its magic on your website.
WebAnalyzer Plus can show you where exactly your visitors click on a webpage. Discover what links, images, and call to action buttons attract users' attention and those that get ignored. Analyze the hot and cold click zones of your website, and improve your conversion by moving the most important page elements like a download button from cold click zone to the hot click zone.
With the flurry of internet enabled devices in the market, it is only natural that the traffic to your website comes from various devices of different screen sizes. This makes it difficult to track the exact location of visitors’ clicks as they will vary depending on the device and its screen size. WebAnalyzer Plus has the capability to identify whether your website is being viewed via a smartphone, a tablet or a PC, and provide device specific heat maps. These heat maps help you identify where exactly the hot and cold click zones lie for each device. With device-specific data, you can come up with an optimized website design appropriate for multiple devices and screen sizes.

PC View

Tablet View

Smartphone View