Network fault monitoring and network fault management are the big challenges when you have a small team. The task becomes more complicated if you have to manage a remote site and have to dispatch a technician to the site only to find out the problem is something you could have fixed remotely or you could find that you don't have the right equipment and have to go back and get it that hurts your service restoration time.
In most cases, the time taken to identify the root cause of a problem is actually longer than the time taken to fix it.
OpManager, a Fault Monitoring Software, constantly monitors fault in the network devices by network device monitoring and simplifies the process of network alert management by implementing advanced alert monitoring capabilities. Having a proactive tool like OpManager that performs Fault Monitoring efficiently and helps you quickly identify the root cause of the problem and fix it before end-users notice it.
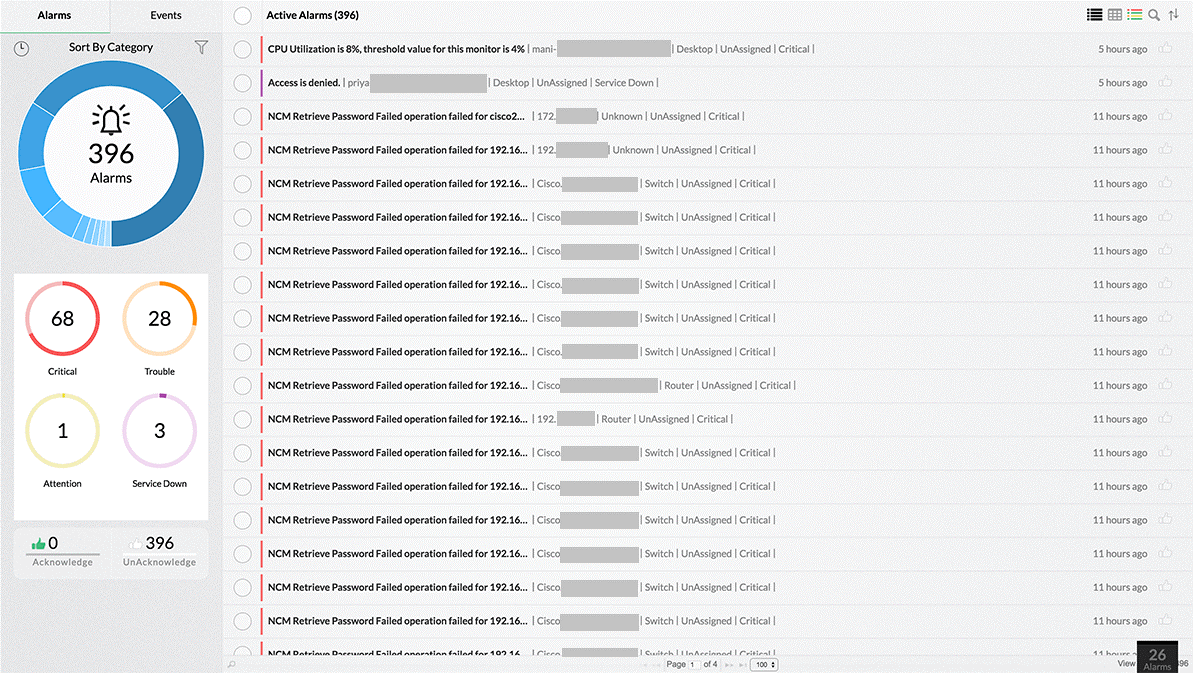
OpManager performs intelligent event processing in the case of network monitoring alerts. It correlates raw network events, filters unwanted events and presents only meaningful alarms to the operator. It supports color-coded alarms which are presented in a user-friendly format. Administrators can view the event history associated with an alarm and manually clear or delete alarms.
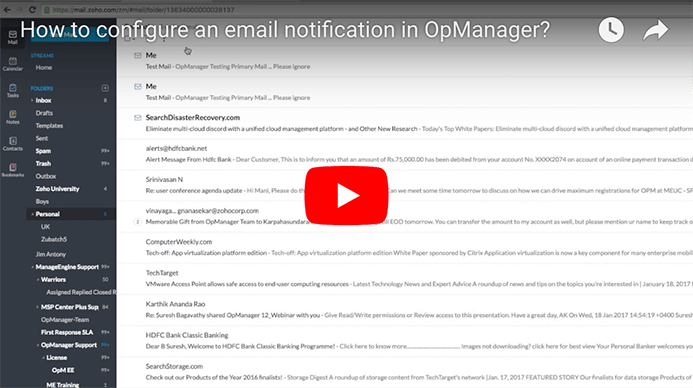
OpManager's notification mechanism can notify you through SMS and/or Email whenever an alarm occurs. Administrators can also configure OpManager to run external programs or homegrown scripts automatically when an alarm occurs.

Most network devices now-a-days are capable of sending out SNMP traps when a fault occurs. A good fault monitoring system should be able to support SNMP traps and provide meaningful information to the operators. OpManager, a Fault Monitoring tool, does exactly that by providing support for basic SNMP traps out-of-the-box. Operators can also add support for traps from any custom SNMP MIB. OpManager can extract useful information that is sent with SNMP traps as variable bindings (SNMP varbinds). So if you have bought devices from different vendors, all you need to do is get access to those vendor-specific MIBS and you can easily have OpManager monitoring critical variables on that device.
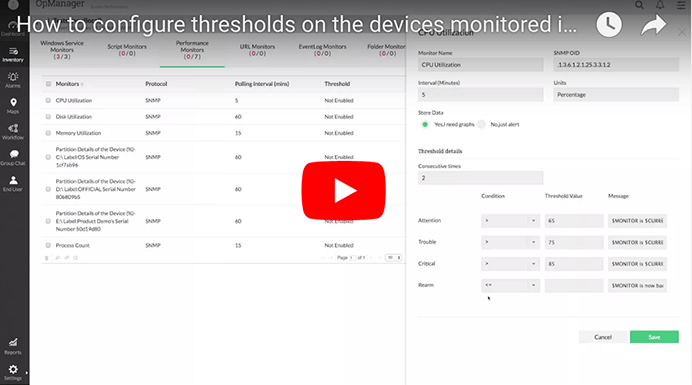
OpManager's Fault monitor supports various alert mechanisms and can alert an operator when a device or service goes down. OpManager can also be configured to alert operators when a service or health check counter on a device exceeds or goes below a certain limit. Operators can also add support for traps from any custom SNMP MIB. OpManager can extract useful information that is sent with SNMP traps as variable bindings (SNMP varbinds).

While working on multiple alarms at the same time, OpManager allows operators to quickly mark alarms on which they have already initiated action, much like marking emails as read or unread. Acknowledging alarms is another small but extremely useful feature for operators to keep track of new alarms and the ones that they have already been read and acted upon.
OpManager alerts the user with a sound alarm for critical notifications. It provides complete customizability, allowing you to filter unwanted alerts and get notification sounds only for critical alerts. All you have to do, is configure a Web Alarm profile to alert you on selective criteria based on your preference.
OpManager allows IT administrators and managers to set up automatic alarm escalation rules. For example, IT managers can setup an escalation rule to get a report of server alarms that are currently open for more than one hour. This report can be periodically sent to the IT manager by email.
If you want to see additional network fault monitoring features implemented in OpManager, we would love to hear. Click here to continue