 Learn more about OpManager's features & functions
Most organizations use servers from multiple vendors, and each run on different operating system (OS) versions. The differences in OS versions can make it challenging to collectively monitor the disk space of all the servers at regular intervals. If you're using your own homegrown scripts to monitor them, then you also need to constantly update those scripts to ensure the latest OS and metrics are supported.
Another challenge lies in being notified too late of a disk space issue. Only by spotting the issue proactively can you look into the disk space and free some up so the application continues to run.
Disk data growth is not predictable; for example, logs could be 10MB over one week, then jump to 10GB overnight. In order to either optimize an application so it doesn't consume a huge amount of space or buy additional hard disks and increase the storage, IT teams need access to disk space trend reports. These reports need to be generated with historical data to understand the trend and make an informed decision.
Another challenge IT admins face is increased mean time to resolve (MTTR). For example, if an application crashes due to a lack of disk space on the server, the organization will experience downtime. And without logs, they have no idea how long it will take to fix the issue, or any idea on how to fix it.
IT admins also face these challenges on a regular basis:
OpManager is an easy-to-use network and server monitoring solution, and functions as both a Linux and Windows disk space monitor tool. This disk space monitor software supports monitoring for a wide range of servers including Windows, Linux, Unix, and Solaris servers, and uses a wide range of protocols such as Simple Network Management Protocol (SNMP), Windows Management Instrumentation (WMI), and command line interface (CLI) to monitor these servers and critical metrics, such as disk space.
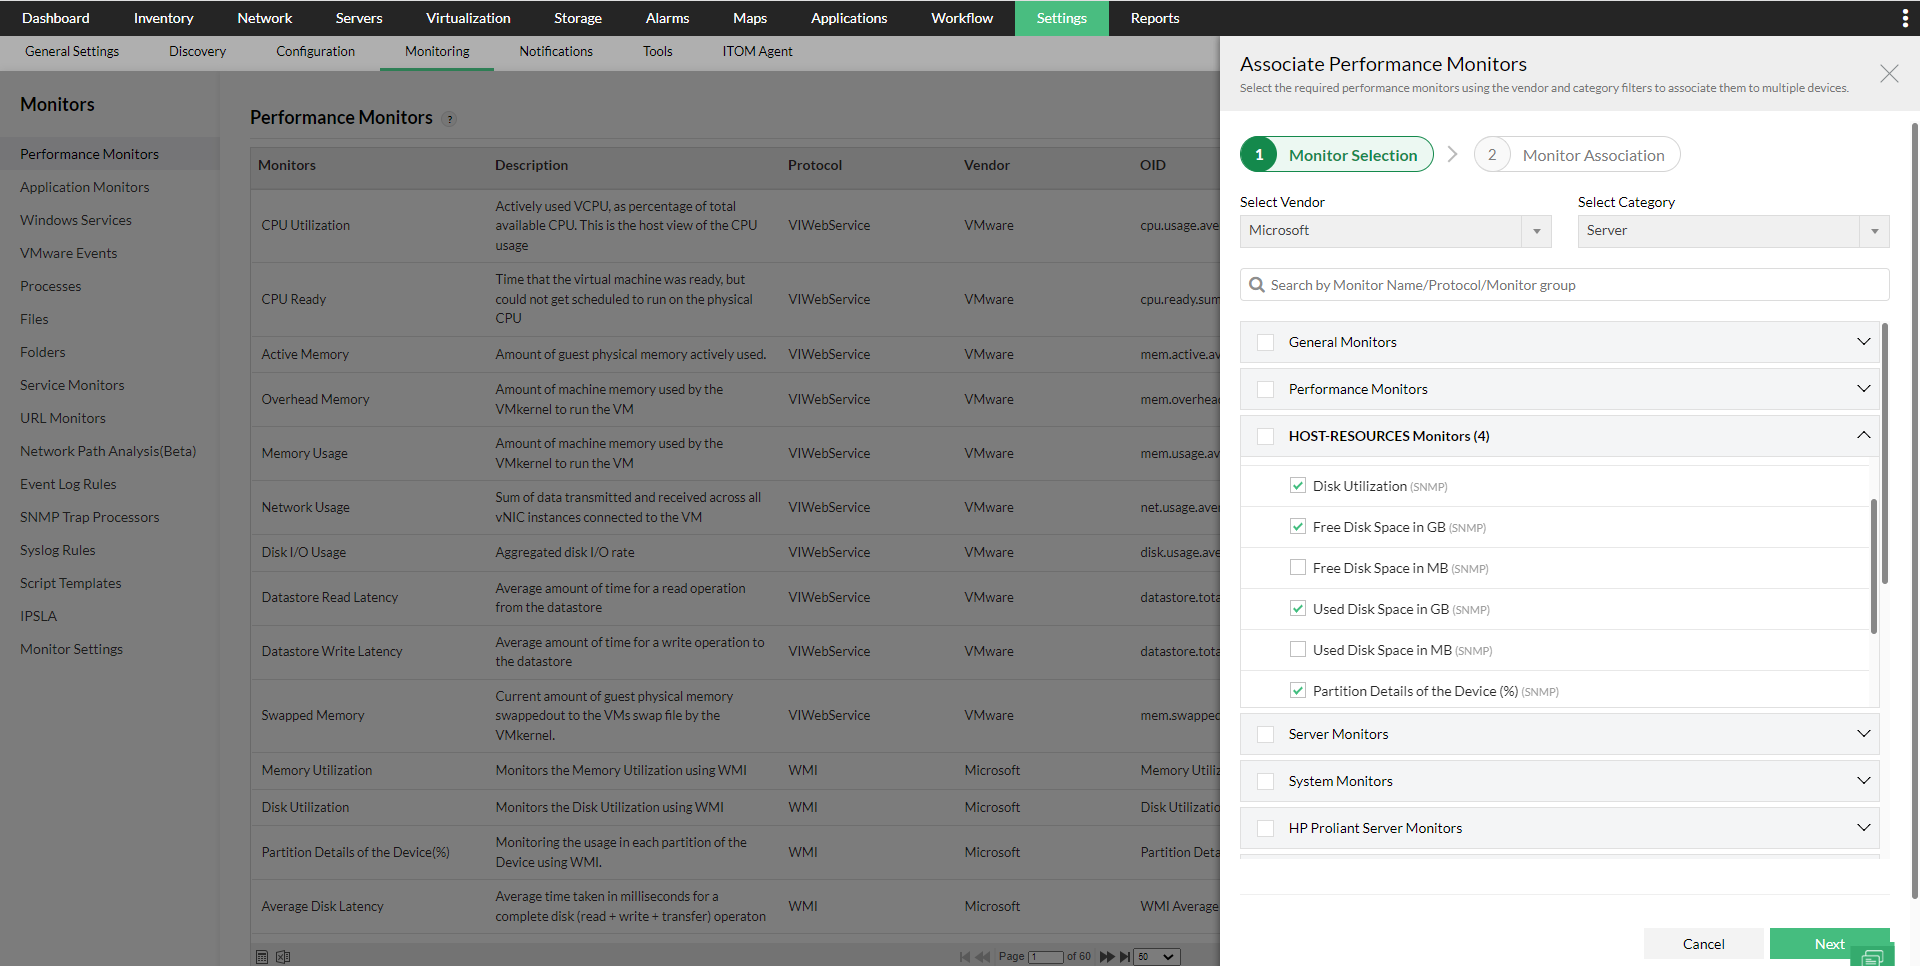
OpManager provides over 42,000 device templates to ensure a disk is immediately recognized, and disk monitoring performance monitors are associated with devices. Once associated with the devices or a set of devices in bulk, the disk performance monitors can be viewed on the Inventory page. Additionally, OpManager has many disk space monitor metrics and over 230 dashboard widgets to monitor specific metrics, including Top VMs by Disk i/o Usage, Disk Reads, etc. to present a quick overview of the prevalent disk space status in the network.


OpManager has a long list of performance monitors, unlike most disk space monitoring tools. Some of them are:
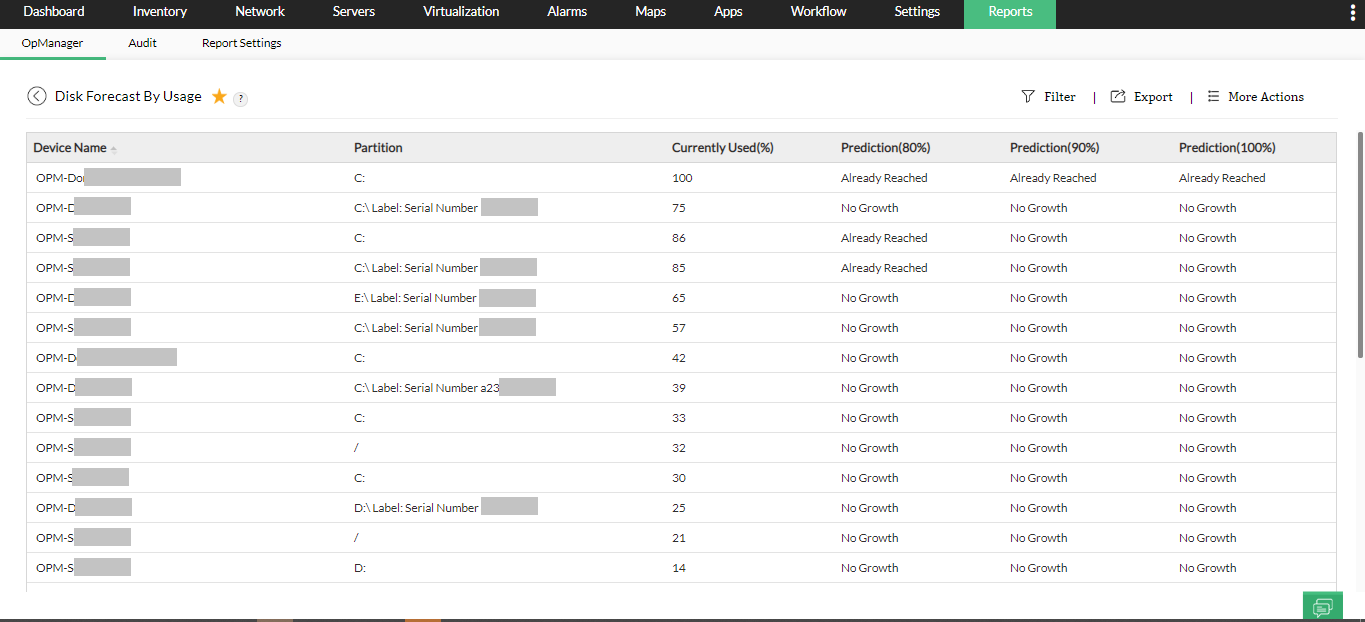
Forecasting the disk space by usage is an important feature used to predict how long storage will last before it runs out of space. OpManager, a disk space usage monitor, analyzes the current usage rate and growth trend on the device, and approximates how long it will be until the storage runs dry. The advantage is that the algorithm provides three predictions: When the storage will reach 80 percent, 90 percent, and 100 percent of its capacity.

Clearing logs is a repetitive, mindless, and painstaking task that has to be performed on a regular basis. Very little human intelligence is needed in such a task, so IT admins usually write scripts or delete logs manually. But there's a better alternative to this process.
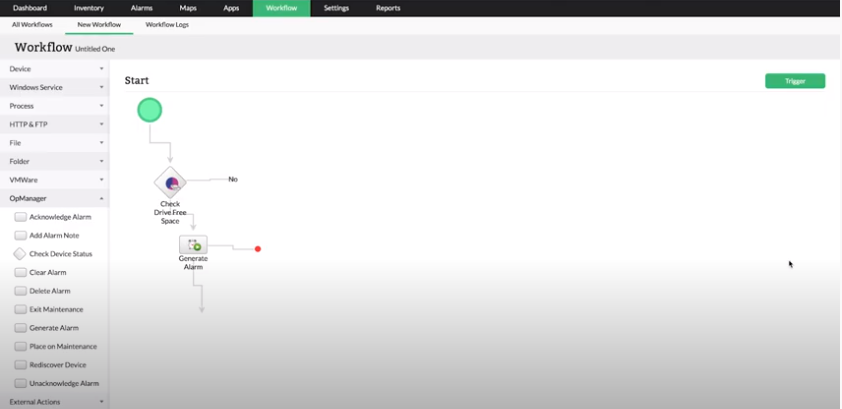
Repetitive but crucial tasks, like checking for free drive space and clearing logs to make space, can be easily automated using OpManager's Workflow feature. To automatically check for free space in the drive, simply use the Check Drive Free Space option available in Workflow actions. Clearing logs to make space on the disk isn't always feasible, so OpManager provides other Workflow actions like Compress file, Compress Folder, Get File Size, List Files, Check Folder Exists, Move Folder, etc. Such Workflows can be scheduled to be triggered periodically, or be manually triggered by the IT admin.

With OpManager, an efficient hard drive monitor as well as disk space monitor, IT admins can create performance baselines and receive threshold violation alerts through SMS, email, push notifications, or web alarms when a threshold is violated. They can also resolve issues by severity, and set up alarm-escalation rules for IT managers to be notified if an issue is not addressed within a specific time frame. Such a robust notification mechanism enables proactive disk space monitoring.
OpManager provides forecast reports for the usage of CPU, memory, and disk for all devices in your network, calculated based on past utilization patterns. Storage reports for all devices and their disks are also available in detail. Additionally, for all disk space performance metrics, reports can be generated instantly, or scheduled to be generated as preferred in PDF or HTML formats.